. 2012 Aug;31(8):1584-92.
doi: 10.1109/TMI.2012.2197218. Epub 2012 May 2.

Fast 3-d tomographic microwave imaging for breast cancer detection

Affiliations

Fast 3-d tomographic microwave imaging for breast cancer detection

Tomasz M Grzegorczyk et al. IEEE Trans Med Imaging. 2012 Aug.

Abstract

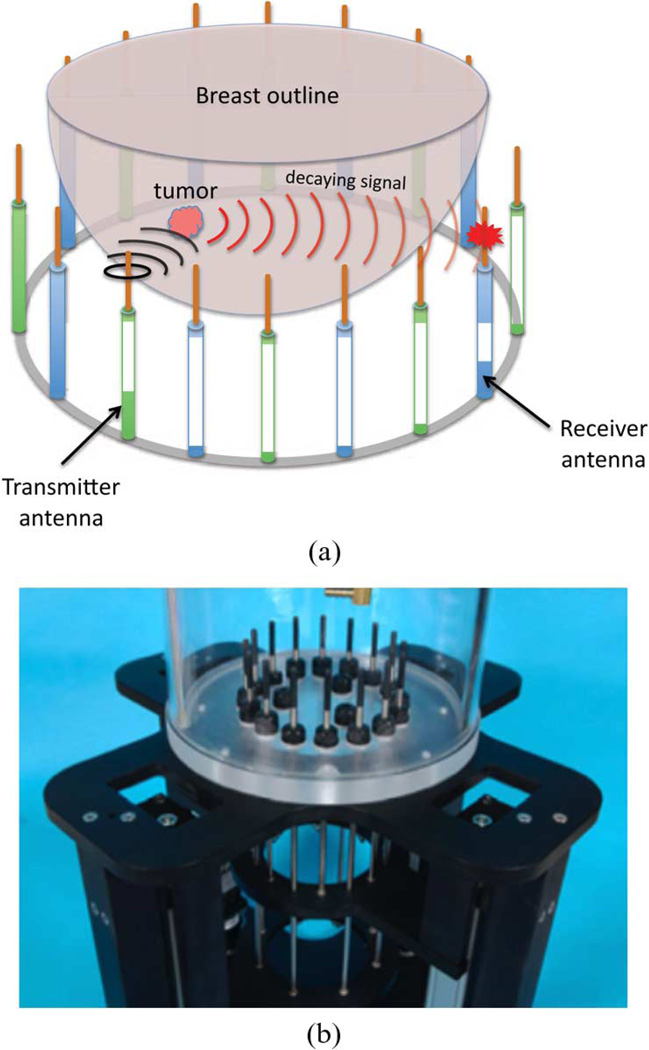
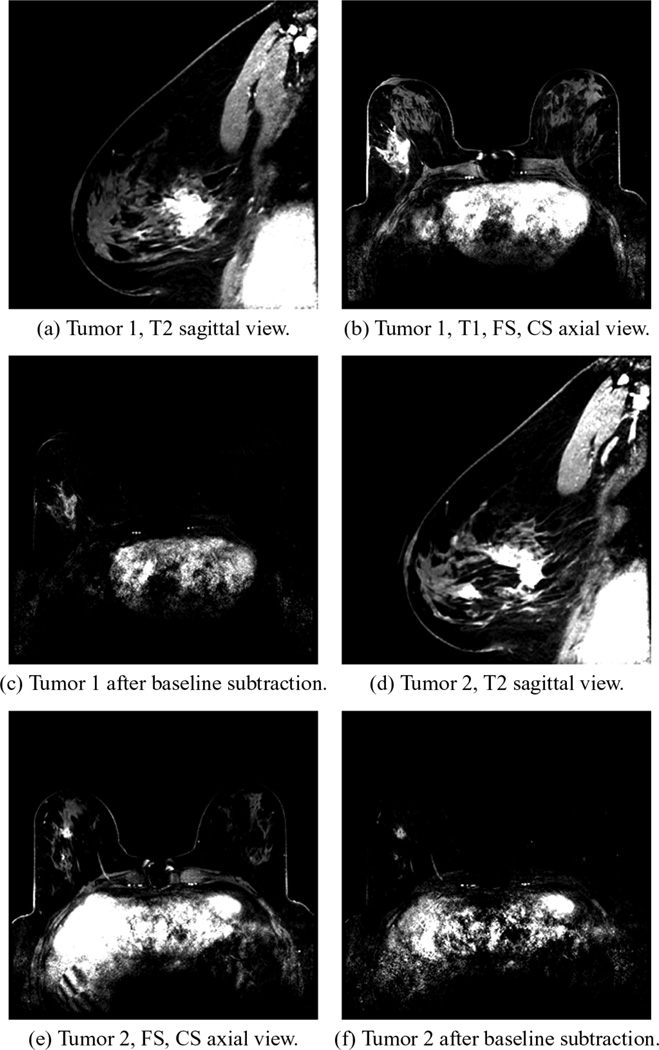
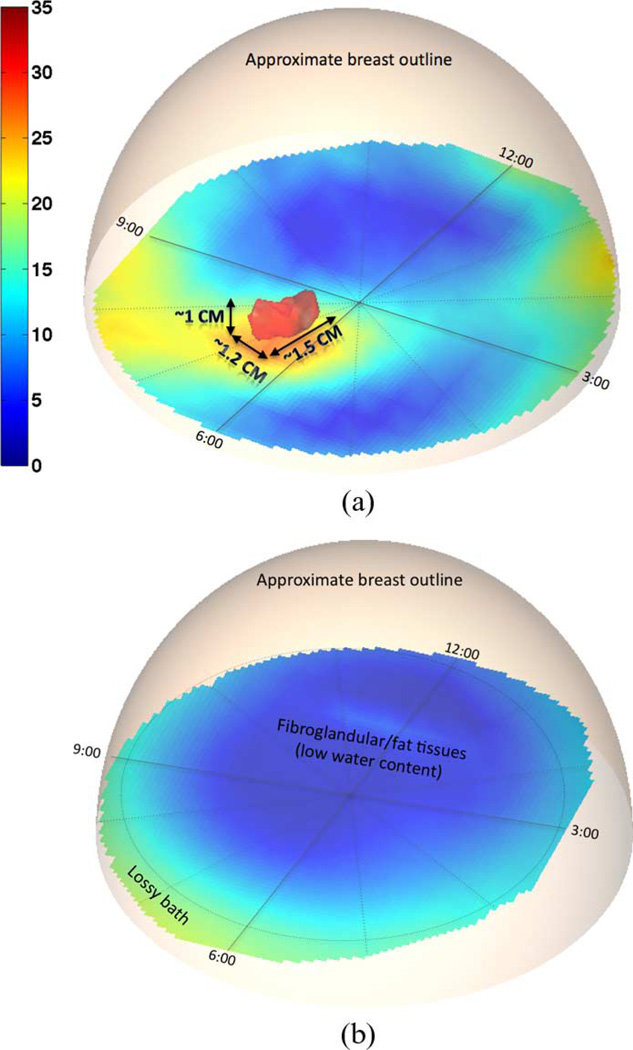
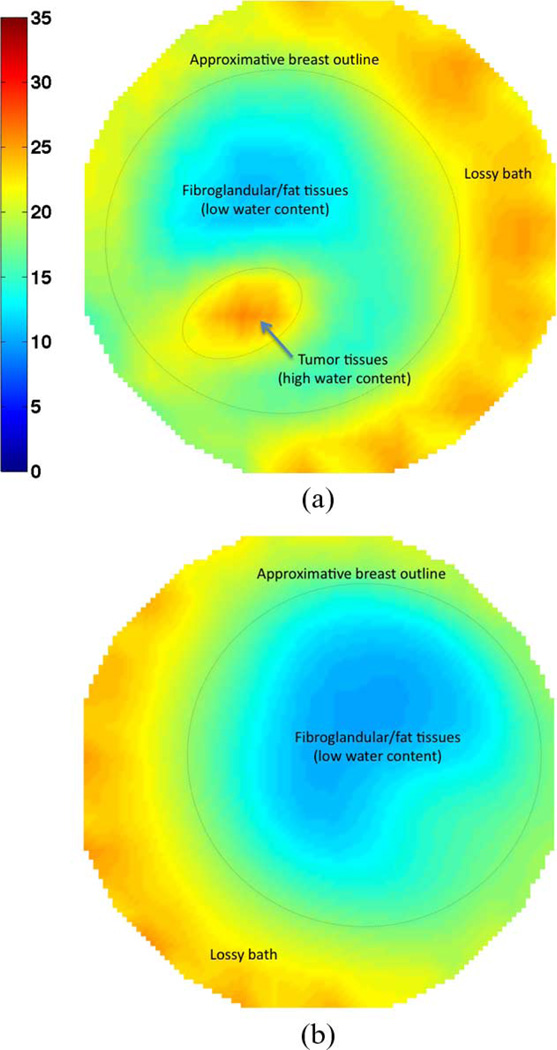
Microwave breast imaging (using electromagnetic waves of frequencies around 1 GHz) has mostly remained at the research level for the past decade, gaining little clinical acceptance. The major hurdles limiting patient use are both at the hardware level (challenges in collecting accurate and noncorrupted data) and software level (often plagued by unrealistic reconstruction times in the tens of hours). In this paper we report improvements that address both issues. First, the hardware is able to measure signals down to levels compatible with sub-centimeter image resolution while keeping an exam time under 2 min. Second, the software overcomes the enormous time burden and produces similarly accurate images in less than 20 min. The combination of the new hardware and software allows us to produce and report here the first clinical 3-D microwave tomographic images of the breast. Two clinical examples are selected out of 400+ exams conducted at the Dartmouth Hitchcock Medical Center (Lebanon, NH). The first example demonstrates the potential usefulness of our system for breast cancer screening while the second example focuses on therapy monitoring.


Figures

Fig. 1
Fig. 1
Schematic representation and actual photograph of our newest data acquisition platform for breast cancer exam. (a) Schematic 3-D representation of our tomographic microwave imaging setup. (b) Assembled antenna hardware.
Fig. 2
Fig. 2
MR images: (a)–(c) are for Tumor 1 and (d)–(f) are for Tumor 2. (a) and (d) are frequency selected fat suppression T2 images, (b) and (e) are T1 fat-suppressed (FS), contrast-enhanced (CS) images, while (c) and (f) are T1, FS, CS subtraction images, respectively.
Fig. 3
Fig. 3
3-D microwave tomographic permittivity images at 1300 MHz. Higher value iso-surfaces reveal the 3-D structure of a tumor in the right breast while none for the left breast. Results have been confirmed by magnetic resonance images. (a) Right breast. (b) Left breast.
Fig. 4
Fig. 4
Directionally averaged 2-D coronal permittivity images at 1300 MHz. The region of high permittivity in the right breast indicates the presence of a tumor which is noticeably absent in the left breast (used as control). (a) Right breast. (b) Left breast.
Fig. 5
Fig. 5
Sagittal MR images of the right breast of the test patient prior to therapy (top row) and after the first set of four cycles of treatment (bottom row). (a) and (d) show the T2 images, (b) and (e) show the T1, FS, CE images, and (c) and (f) are the same as (b) and (e) with a subtracted baseline before contrast injection.
Fig. 6
Fig. 6
Permittivity images at 1300 MHz at six dates as the patient underwent chemotherapy. The 2-D images are obtained by performing a coronal averaging of the 3-D images shown in Fig. 8. Numerical values show the mean and standard deviation (in parenthesis) of dielectric properties. (a) Day 1. (b) 23 Days. (c) 44 Days. (d) 114 Days. (e) 163 Days. (f) 229 Days.
Fig. 7
Fig. 7
Same as Fig. 6 but for conductivity images. Numerical values show the mean and standard deviation (in parenthesis) of dielectric properties. (a) Day 1. (b) 23 Days. (c) 44 Days. (d) 114 Days. (e) 163 Days. (f) 229 Days.
Fig. 8
Fig. 8
3-D permittivity images at 1300 MHz for six dates as the patient underwent chemotherapy. The contour of the breast is shown in which the isolevel relative permittivity ∊ = 44 has been isolated. The evolution of the contour with time illustrates the shrinking tumor during the chemotherapy treatment. (a) Day 1. (b) 23 Days. (c) 44 Days. (d) 114 Days. (e) 163 Days. (f) 229 Days.

References

    1. Fass L. Imaging and cancer: A review. Molecular Oncol. 2008;vol. 2:115–152. - PMC - PubMed
    1. Lazebnik M, Popovic D, McCartney L, Watkins CB, Lind-strom MJ, Harter J, Sewall S, Ogilvie T, Magliocco A, Breslin TM, Temple W, Mew D, Booske JH, Okoniewski M. A large-scale study of the ultrawideband microwave dielectric properties of normal, benign and malignant breast tissues obtained from cancer surgeries. Phys. Med. Biol. 2007 Oct;vol. 52(no. 20):6093–6115. - PubMed
    1. Chaudhary SS, Mishra RK, Swarup A, Thomas JM. Dielectric-properties of normal and malignant human-breast tissues at radiowave and microwave-frequencies. Indian J. Biochem. Biophys. 1984;vol. 21(no. 1):76–79. - PubMed
    1. Joines WT, Zhang Y, Li CX, Jirtle RL. The measured electrical-properties of normal and malignant human tissues from 50 to 900 MHz. Med. Phys. 1994 Apr;vol. 21(no. 4):547–555. - PubMed
    1. Duck FA. Physical Properties of Tissue: A Comprehensive Reference Book. London, U.K: Academic; 1090.

Publication types