. 2012 May 22;109(21):8274-9.
doi: 10.1073/pnas.1204789109. Epub 2012 May 4.

Functional imaging reveals rapid reorganization of cortical activity after parietal inactivation in monkeys

Affiliations

Functional imaging reveals rapid reorganization of cortical activity after parietal inactivation in monkeys

Melanie Wilke et al. Proc Natl Acad Sci U S A. .

Abstract

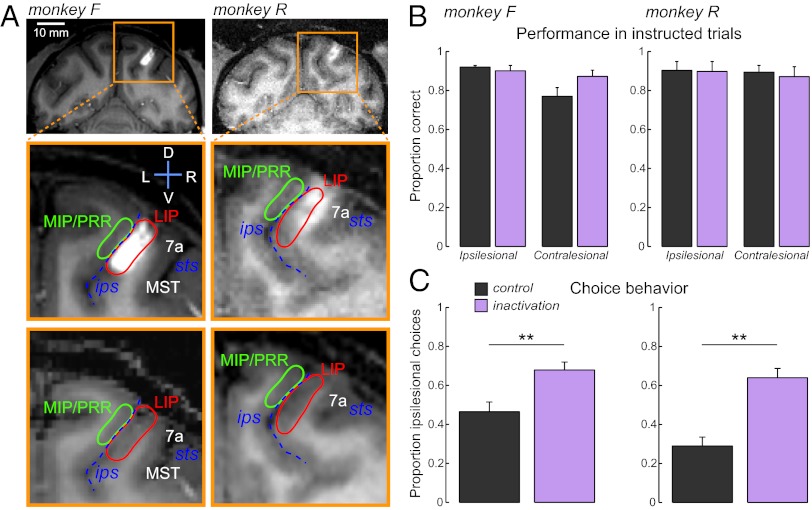
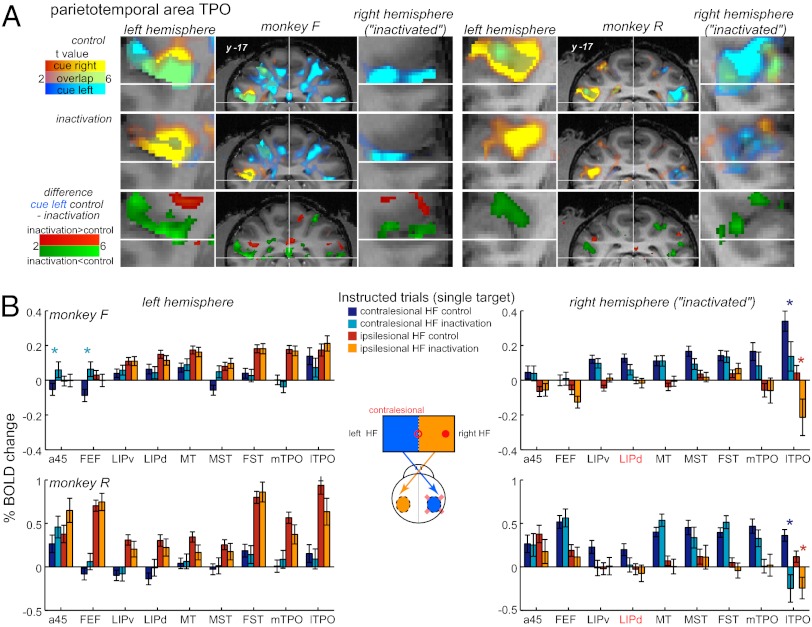
Impairments of spatial awareness and decision making occur frequently as a consequence of parietal lesions. Here we used event-related functional MRI (fMRI) in monkeys to investigate rapid reorganization of spatial networks during reversible pharmacological inactivation of the lateral intraparietal area (LIP), which plays a role in the selection of eye movement targets. We measured fMRI activity in control and inactivation sessions while monkeys performed memory saccades to either instructed or autonomously chosen spatial locations. Inactivation caused a reduction of contralesional choices. Inactivation effects on fMRI activity were anatomically and functionally specific and mainly consisted of: (i) activity reduction in the upper bank of the superior temporal sulcus (temporal parietal occipital area) for single contralesional targets, especially in the inactivated hemisphere; and (ii) activity increase accompanying contralesional choices between bilateral targets in several frontal and parieto-temporal areas in both hemispheres. There was no overactivation for ipsilesional targets or choices in the intact hemisphere. Task-specific effects of LIP inactivation on blood oxygen level-dependent activity in the temporal parietal occipital area underline the importance of the superior temporal sulcus for spatial processing. Furthermore, our results agree only partially with the influential interhemispheric competition model of spatial neglect and suggest an additional component of interhemispheric cooperation in the compensation of neglect deficits.


Conflict of interest statement

The authors declare no conflict of interest.

Figures

Fig. 1.
Fig. 1.
The task and corresponding task-related BOLD activity. (A) Delayed memory-guided saccade task. In instructed trials, one target was presented in either the left or right hemifield at one of 18 possible positions. In the choice trials two targets appeared simultaneously, on the right and on the left equidistantly from the central fixation point. (B) Cortical areas activated in control sessions by +cue (yellow-red) and +saccade (purple-blue) contrasts, shown on the inflated brain surface of each monkey. (C) Typical ERA BOLD trial time-courses from the right LIP for the four trial conditions. The gray box denotes the time interval used for estimating cue/delay mean response amplitude, short black line under the curves represents the last two samples of initial fixation used as a baseline for estimating percent BOLD signal change. Shaded bands denote SEM across trials.
Fig. 2.
Fig. 2.
Inactivation sites and behavioral choice bias. (A, Top) Coronal T1-weighted MR sections visualizing right hemisphere injection sites with gadolinium MR contrast agent (white). (Middle and Bottom) Magnified view of inactivation area, with and without injection. The injection images were acquired 15–30 min after the 4-μL infusion. The injection spreads along the lateral bank of the intraparietal sulcus. Abbreviations: ips, intraparietal sulcus; sts, superior temporal sulcus; LIP, lateral intraparietal area (target); MIP, medial intraparietal area; MST, middle superior temporal area; PRR, parietal reach region. (B) Proportion of correct saccades to targets in the ipsi- or contralesional hemifield during control and inactivation sessions. (C) Proportion of choices toward the ipsilesional hemifield. Note the increase of choices toward ipsilesional targets in inactivation sessions. Number of sessions and single session data can be found in SI Appendix, Table S1. Error bars indicate SEM across sessions, **P < 0.01.
Fig. 3.
Fig. 3.
Inactivation effects in instructed trials. (A) Superimposed activity maps for +cue left and +cue right contrast (first two rows in each panel), and contralesional cue left “control minus inactivation” difference (third row) in example coronal sections through sts, with enlarged maps around area TPO. Inactivation effects on contralesional cue activity can be seen as diminished cyan-blue clusters and as green clusters in difference maps in both hemispheres (see Fig. S1B for more sections). Coordinates are in AC-PC plane. (B) ROI analysis showing cue/delay activity in activated areas, as a function of visual hemifield, hemisphere, and session type. Error bars indicate SEM across trials. The asterisk represents significant difference for the control vs. inactivation comparison for the same hemifield (P < 0.05, t test, star color signifies the direction of the change). De-emphasized bars for the right LIPd/v signify a mixture of local inactivation and gadolinium effects. Trial numbers for each monkey and condition are listed in SI Appendix, Table S4 and statistics are presented in SI Appendix, Table S5. HF, hemifield.
Fig. 4.
Fig. 4.
Inactivation effects in choice trials. (A) ROI analysis showing average cue/delay activity in choice trials in control and inactivation sessions. Error bars indicate SEM across trials, *P < 0.05, star color corresponds to the larger condition (statistics presented in SI Appendix, Table S6). (Inset) Predictions of the IHC model. (B) Relative activity difference between ipsi- and contralesional choice trials. Bar amplitudes represent average cue/delay activity difference across sessions (left contralesional choices minus right ipsilesional choices; positive values: left > right; negative values: left < right). Note the increased positive values in several areas, in both hemispheres, following the inactivation (purple > gray), indicating differential enhancement in trials when monkeys choose the contralesional hemifield. Error bars indicate SEM across sessions, *P < 0.05 (statistics presented in SI Appendix, Table S7). (Left and Right Insets) ERA BOLD time-courses from left LIP (Left) and right lTPO (Right) before and after inactivation (see SI Appendix, Fig. S5 for other ROIs). Shaded error bands indicate SEM across trials; blue/orange stars, significant difference between left and right trials in at least one time sample (P < 0.05, sample-wise t test). (Center Inset) Predictions of the IHC model.

Similar articles

Cited by

References

    1. Kerkhoff G. Spatial hemineglect in humans. Prog Neurobiol. 2001;63:1–27. - PubMed
    1. Mesulam MM. Spatial attention and neglect: Parietal, frontal and cingulate contributions to the mental representation and attentional targeting of salient extrapersonal events. Philos Trans R Soc Lond B Biol Sci. 1999;354:1325–1346. - PMC - PubMed
    1. Vuilleumier PO, Rafal RD. A systematic study of visual extinction. Between- and within-field deficits of attention in hemispatial neglect. Brain. 2000;123:1263–1279. - PubMed
    1. Bisiach E. Extinction and neglect: Same or different? In: Paillard J, editor. Brain and Space. Oxford: Oxford Univ Press; 1991. pp. 251–257.
    1. Karnath HO, Himmelbach M, Küker W. The cortical substrate of visual extinction. Neuroreport. 2003;14:437–442. - PubMed

Publication types

MeSH terms