. 2012 Jul 1;28(13):1721-8.
doi: 10.1093/bioinformatics/bts260. Epub 2012 May 3.

Identifying differentially expressed transcripts from RNA-seq data with biological variation

Affiliations

Identifying differentially expressed transcripts from RNA-seq data with biological variation

Peter Glaus et al. Bioinformatics. .

Abstract

Motivation: High-throughput sequencing enables expression analysis at the level of individual transcripts. The analysis of transcriptome expression levels and differential expression (DE) estimation requires a probabilistic approach to properly account for ambiguity caused by shared exons and finite read sampling as well as the intrinsic biological variance of transcript expression.

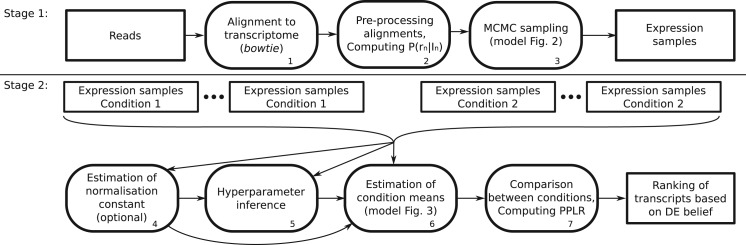
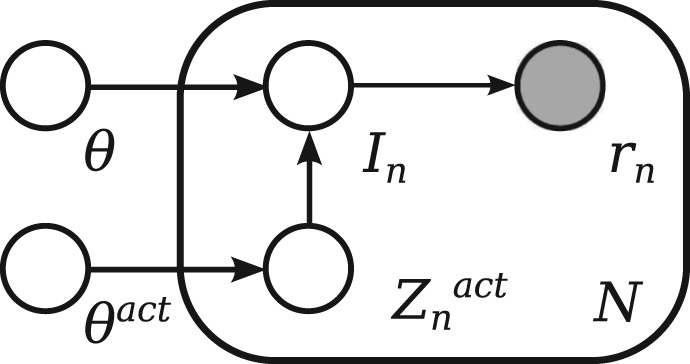
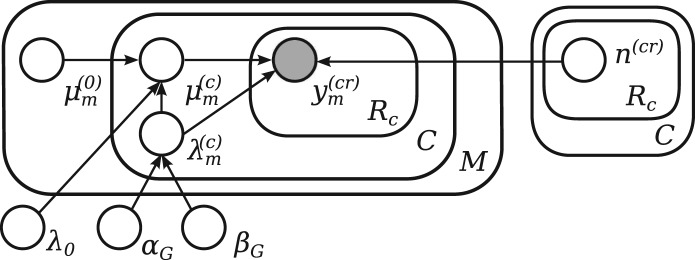
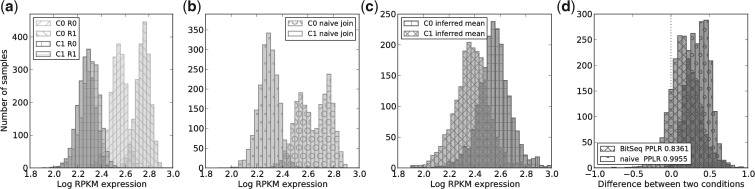
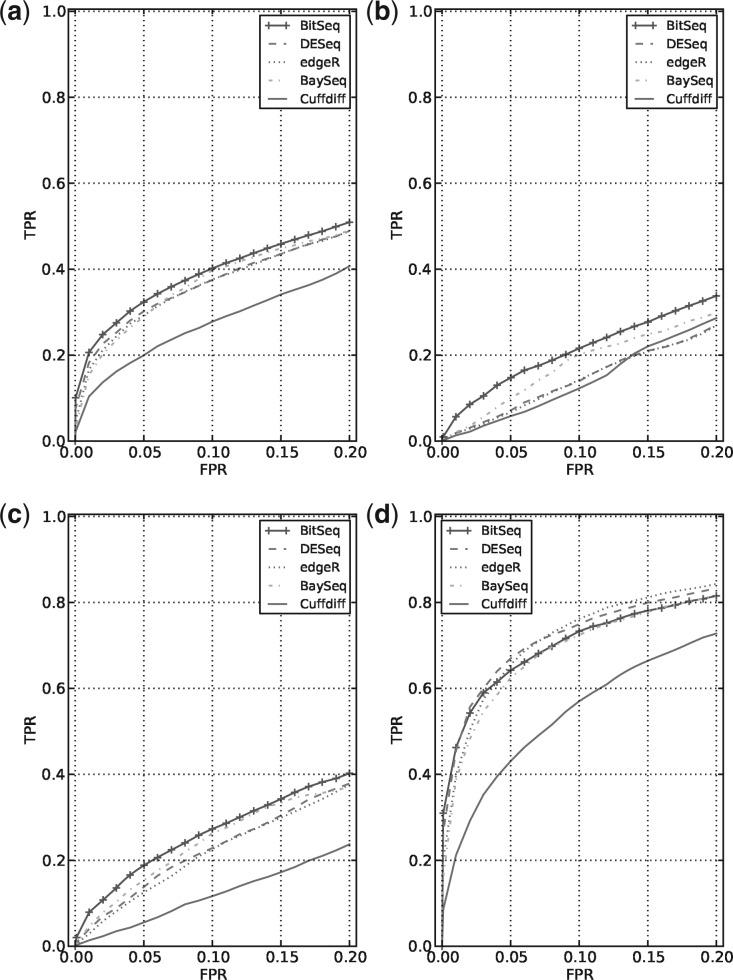
Results: We present Bayesian inference of transcripts from sequencing data (BitSeq), a Bayesian approach for estimation of transcript expression level from RNA-seq experiments. Inferred relative expression is represented by Markov chain Monte Carlo samples from the posterior probability distribution of a generative model of the read data. We propose a novel method for DE analysis across replicates which propagates uncertainty from the sample-level model while modelling biological variance using an expression-level-dependent prior. We demonstrate the advantages of our method using simulated data as well as an RNA-seq dataset with technical and biological replication for both studied conditions.

Availability: The implementation of the transcriptome expression estimation and differential expression analysis, BitSeq, has been written in C++ and Python. The software is available online from http://code.google.com/p/bitseq/, version 0.4 was used for generating results presented in this article.


Figures

Fig. 1.
Fig. 1.
Diagram showing the BitSeq analysis pipeline divided into two separate stages. In Stage 1, transcript expression levels are estimated using reads from individual sequencing experiments. In Step 1, reads are aligned to the transcriptome. In Step 2, the probability of a read originating from a given transcript P(rn|In) is computed for each alignment based on Equation (1). These probabilities are used in Step 3 of the analysis, MCMC sampling from the posterior distribution in Equation (3). In Stage 2 of the analysis, the posterior distributions of transcript expression levels from multiple conditions and replicates are used to infer the probability that transcripts are differentially expressed. In Step 4, a suitable normalization for each experiment is estimated. The normalized expression samples are further used to infer expression-dependent variance hyperparameters in Step 5. Using these results, replicates are summarized by estimating the percondition mean expression for each transcript, Equation (4), in Step 6. Finally, in Step 7, samples representing the distribution of within-condition expression are used to estimate the probability of positive log ratio (PPLR) between conditions, which is used to rank transcripts based on DE belief
Fig. 2.
Fig. 2.
Graphical representation of the RNA-seq data probabilistic model. We can consider the observation of reads R=(r1,…, rN) as N conditionally independent events, with each observation of a read rn depending on the transcript (or isoform) it originated from In. The probability of sequencing a given transcript In depends on the relative expression of fragments θ and the noise indicator Znact. The noise indicator variable Znact depends on noise parameter θact and indicates that the transcript being sequenced is regarded as noise, which enables observation of low-quality and unmappable reads
Fig. 3.
Fig. 3.
Graphical model of the biological variance in transcript expression experiment. For replicate r, condition c and transcript m, the observed log-expression level ym(cr) is normally distributed around the normalized condition mean expression μm(c)+n(cr) with biological variance 1/λm(c). The condition mean expression μm(c) for each condition is normally distributed with overall mean expression μm(0) and scaled variance 1/(λ(c)mλ0). The inverse variance, or precision λ(c)m, for a given transcript m follows a Gamma distribution with expression-dependent hyperparameters αG, βG, which are constant for a group of transcripts G with similar expression
Fig. 4.
Fig. 4.
In plots (a) and (b), we show the posterior transcript expression density for pairs of transcripts from the same gene. This is a density map constructed using the MCMC expression samples for these three transcripts. In (c), we show the marginal posterior distribution of expression levels of the same transcripts as illustrated by histograms of MCMC samples. The sequencing data are from miRNA-155 study published by Xu et al. (2010)
Fig. 5.
Fig. 5.
Comparison of BitSeq to naive approach for combining replicates within a condition for transcript uc001avk.2 of the Xu et al. dataset. (a) Initial posterior distributions of transcript expression levels for two conditions (labelled C0, C1), with two biological replicates each (labelled R0, R1). (b) Mean expression level for each condition using the naive approach for combining replicates. The posterior distributions from replicates are joined into one dataset for each condition. (c) Inferred posterior distribution of mean expression level for each condition using the probabilistic model in Figure 3. (d) Distribution of differences between conditions from both approaches show that the naive approach leads to overconfident conclusion
Fig. 6.
Fig. 6.
ROC evaluation of transcript level DE analysis using artificial dataset, comparing BitSeq with alternative approaches. DESeq, edgeR and baySeq use transcript expression estimates from BitSeq Stage 1 converted to counts. The curves are averaged over five runs with different set of transcripts being differentially expressed by fold change uniformly distributed in the interval (1.5,3.5). We discarded transcripts without any reads initially generated as these provide no signal. Panel (a) shows global average behaviour whereas in (b), (c) and (d) transcripts were divided into three equally sized groups based on the mean generative read count: [1,3), [3,19) and [19, ∞), respectively

References

    1. Anders S., Huber W. Differential expression analysis for sequence count data. Genome Biol. 2010;11:R106. - PMC - PubMed
    1. Cleveland W. S. LOWESS: a program for smoothing scatterplots by robust locally weighted regression. Am. Stat. 1981;35:54.
    1. Cloonan N., et al. Stem cell transcriptome profiling via massive-scale mRNA sequencing. Nat. Methods. 2008;5:613–619. - PubMed
    1. Dohm J. C., et al. Substantial biases in ultra-short read data sets from high-throughput DNA sequencing. Nucleic Acids Res. 2008;36:e105. - PMC - PubMed
    1. Gelman A., et al. Bayesian Data Analysis. 2. Chapman and Hall/CRC; 2003.

Publication types