. 2012 Jun 22;287(26):21836-45.
doi: 10.1074/jbc.M112.346114. Epub 2012 May 4.

Novel mechanism for negatively regulating Rho-kinase (ROCK) signaling through Coronin1B protein in neuregulin 1 (NRG-1)-induced tumor cell motility

Affiliations

Novel mechanism for negatively regulating Rho-kinase (ROCK) signaling through Coronin1B protein in neuregulin 1 (NRG-1)-induced tumor cell motility

Manish K Rana et al. J Biol Chem. .

Abstract

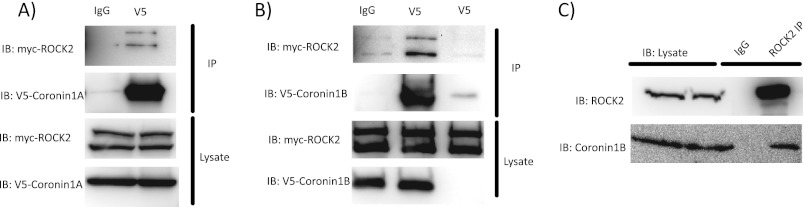
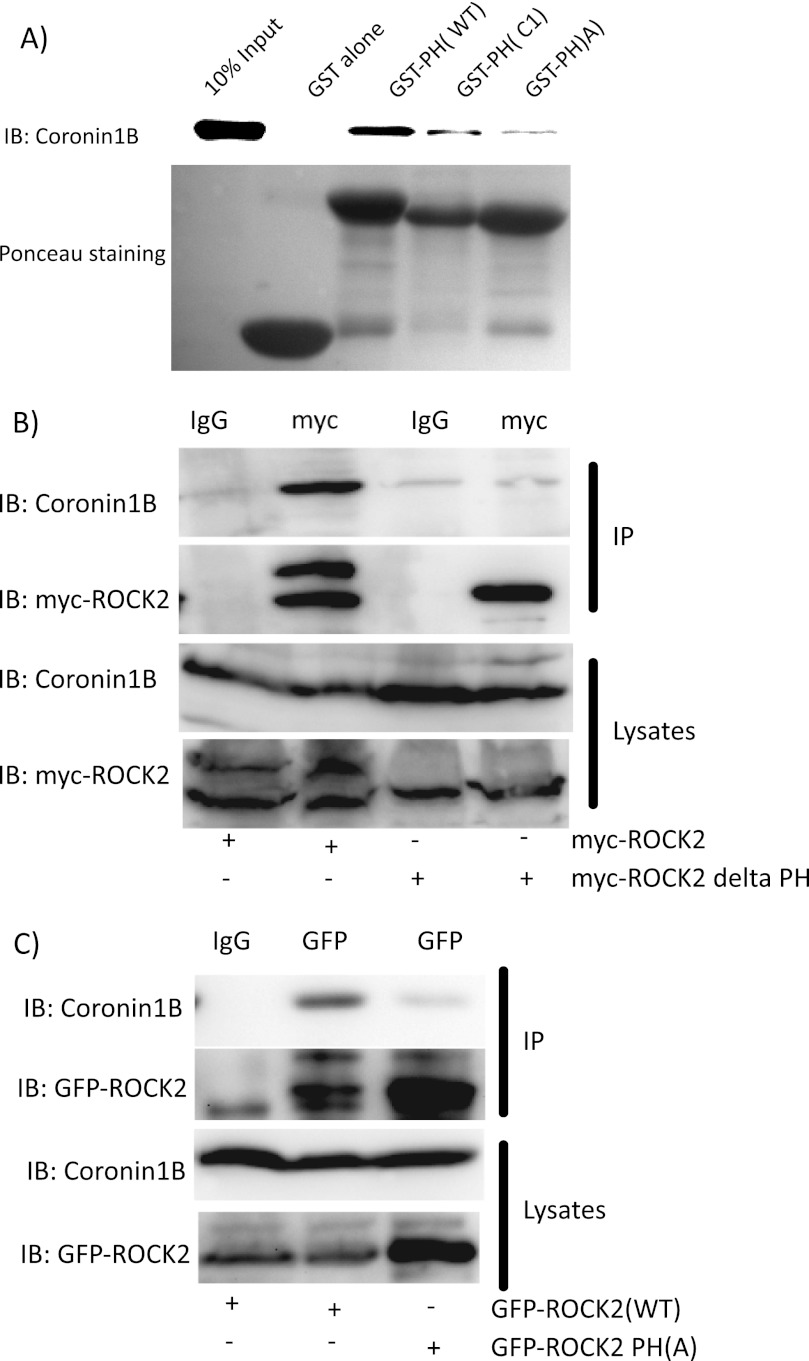
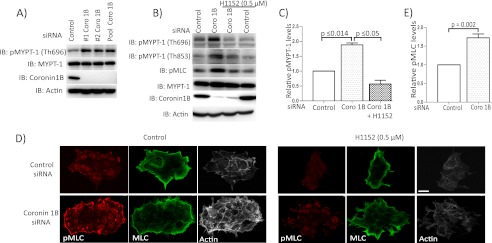
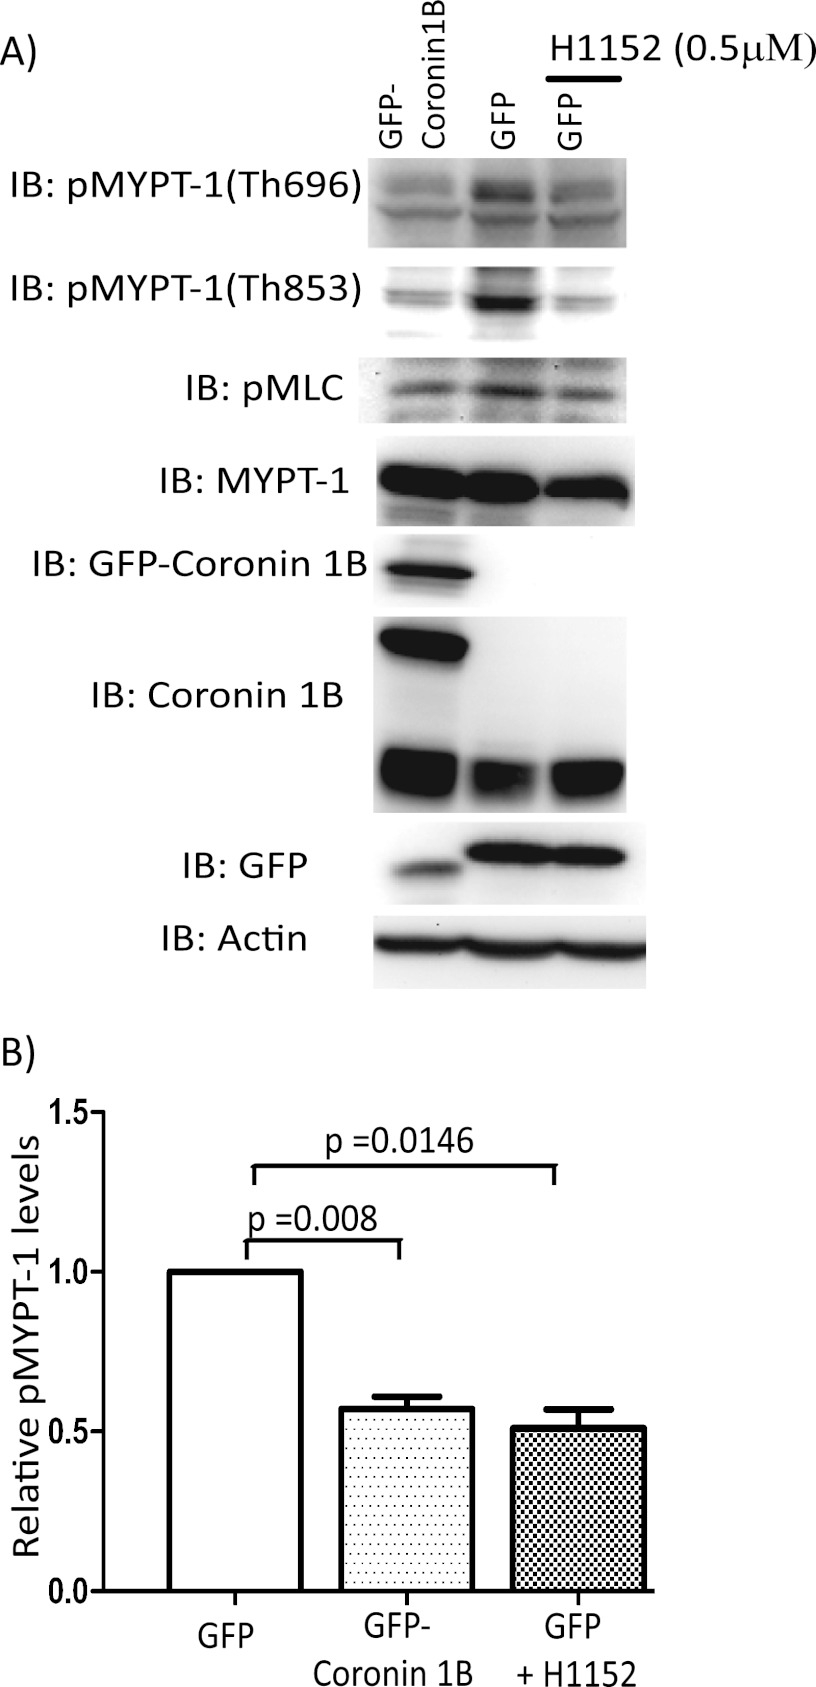
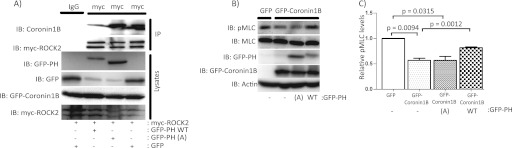
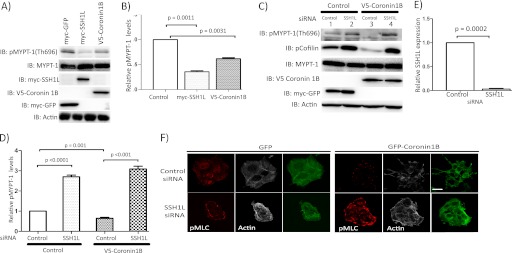
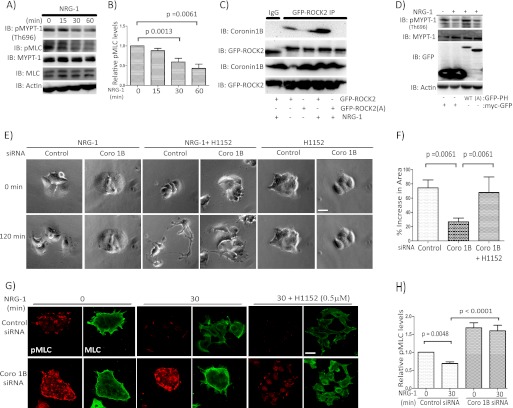
Although many mechanisms that activate ROCK are known, corresponding negative regulatory mechanisms required for cytoskeletal plasticity are poorly understood. We have discovered that Coronin1B is a novel attenuator of ROCK signaling. We initially identified Coronin1A in a proteomics screen for ROCK2-binding proteins, and here we demonstrate that Coronin1A/B bind directly to ROCK2 through its PH (Pleckstrin Homology) domain. The consequence of the ROCK2-Coronin1B interaction was tested and revealed that increased expression of Coronin1B inhibited, whereas knockdown of Coronin1B stimulated, phosphorylation of the ROCK substrate myosin light chain phosphatase and subsequently, myosin light chain. Thus, Coronin1B is a previously unrecognized inhibitor of ROCK signaling to myosin. Furthermore, we found that the phosphatase Slingshot IL (SSH1L) was required for Coronin1B to inhibit ROCK signaling. To test the significance of this novel mechanism in tumor cell motility, we investigated its role in neuregulin 1 (NRG-1)-induced cell scattering. Importantly, we found that attenuation of the ROCK signaling by Coronin1B was required for NRG-1 stimulated scattering. Our data support a model in which Coronin1B fine-tunes ROCK signaling to modulate myosin activity, which is important for tumor cell motility.


Figures

FIGURE 1.
FIGURE 1.
ROCK2 and Coronin1A/B form a complex in cells. A, COS-7 cells expressing myc-ROCK2 and V5-Coronin1A were immunoprecipitated (IP) with anti-V5 antibody or control IgG. Co-immunoprecipitation of myc-ROCK2 was determined by immunoblotting (IB). B, COS-7 cells expressing myc-ROCK2 and V5-Coronin1B were analyzed as above. C, MCF7-CXCR4 cells were immunoprecipitated with anti-ROCK2 antibody or control IgG. Co-immuoprecipitation of endogenous Coronin1B was determined by immunoblotting. Blots shown are representative of at least three independent experiments and show that both Coronin1A/B form a complex with ROCK2 in cells.
FIGURE 2.
FIGURE 2.
Coronin1B binds to ROCK2 PH domain. A, recombinant His-Coronin1B was incubated with immobilized GST (second lane) or GST-PH(WT) (third lane) GST-PH(ΔC1) (fourth lane) or GST-PH(A) (fifth lane). 10% of the His-Coronin1B used in the binding assay was run in the input lane for reference. Bound proteins were detected by immunoblotting (IB; top). B, MCF7-CXCR4 cells were transiently transfected with myc-ROCK2 or myc-ROCK2ΔPH, and Coronin binding was tested by co-immunoprecipitation, as above. The blots shown are representative of three independent experiments and show that the ROCK2 PH domain is required for ROCK2-Coronin1B interaction in cells. C, MCF7-CXCR4 cells expressing GFP-ROCK2(WT) or GFP-ROCK2(A), and their interaction with endogenous Coronin1B determined by co-immunoprecipitation, as above, are shown. The blots are representative of three independent experiments and show that ROCK2 harboring a mutation in its PH (Pleckstrin Homology) domain fails to interact with Coroinin1B.
FIGURE 3.
FIGURE 3.
Knockdown of Coronin1B stimulates MYPT-1 and MLC phosphorylation. A, cells were treated with control or the Coronin1B siRNA and then blotted (IB) for p-MYPT-1 (Thr-696 antibody). Effectiveness of the Coronin1B knockdown is shown by Coronin1B immunoblotting, and equal loading is demonstrated by total MYPT-1 and actin immunoblots. B, to assess whether the increase in MYPT-1(Thr-696 or Thr-853) and MLC phosphorylation were dependent on ROCK activity, the Coronin1B knockdown cells were treated with ROCK pharmacological inhibitor H1152 30 min before lysis. The effectiveness of the Coronin1B knockdown is shown by Coronin1B immunoblotting, and equal loading is demonstrated by total MYPT-1 and actin immunoblotting. C, blots from B are quantitated. Bars represent the average ± S.E. (error bars) from three independent experiments. D, cells treated with control or Coronin1B siRNA were analyzed by immunofluorescence microscopy for phosphorylated MLC (red), MLC (green), and actin (gray). Cells were treated with ROCK pharmacological inhibitor H1152 30 min before fixation to test the dependence on ROCK activity. Scale bar, 10 μm. E, blots from D are quantitated. Bars represent the average ± S.E. (error bars) from three independent experiments and show that knockdown of Coronin1B increases phosphorylation of MYPT-1 and MLC and organized actin in a ROCK-dependent manner.
FIGURE 4.
FIGURE 4.
Increased expression of Coronin1B inhibits MYPT-1 and MLC phosphorylation. A, MCF7-CXCR4 stable cells expressing either GFP or GFP-Coronin1B were blotted (IB) for levels of phosphorylated levels of MYPT-1 (Thr-696 and Thr-853 antibody) and p-MLC. In some cases cells were treated with H1152 (0.5 μm, for 30 min) before lysis. Immunoblotting for total MYPT-1 and actin was used as a loading control, and the expression of GFP-Coronin1B was verified by GFP and Coronin1B immunoblotting. B, quantification of the band intensities of p-MYPT-1 levels are shown in the graph. The bars represent the average ± S.E. (error bars) from three independent experiments and show that increased expression of Coronin1B reduces the phosphorylation of the ROCK targets, MYPT-1 (Thr-696 or Thr-853), and p-MLC.
FIGURE 5.
FIGURE 5.
ROCK2 PH domain acts as a dominant negative for Coronin1B attenuation of ROCK signaling. A, MCF7-CXCR4 cells expressing GFP-ROCK2 PH(WT), GFP ROCK2 PH(A), or GFP alone with myc-ROCK2, and the presence of endogenous Coronin1B in the myc immune complex were determined by Western blotting (IB). B, MCF7-CXCR4 GFP or GFP-Coronin1B cells were transfected with GFP-PH(WT), GFP-PH(A), or vector control and p-MLC determined by immunoblotting. Actin and total MLC are loading controls, and the expression of GFP-PH(WT) or GFP-ROCK2 PH domain(A) is shown with GFP blotting. C, quantitation of the band intensities of p-MLC levels are shown in the graph. Bars represent the average ± S.E. (error bars) from three independent experiments and show that ROCK2 PH domain acts as a dominant negative for Coronin1B-mediated inhibition of ROCK signaling to myosin.
FIGURE 6.
FIGURE 6.
Overexpression of SSH1L reduces MYPT-1 phosphorylation, and Coronin1B requires SSH1L to inhibit MYPT-1 and MLC phosphorylation. A, cells expressing myc-GFP or myc-SSH1L or V5-Coronin1B were immunoblotted (IB) for p-MYPT-1. For comparison, a sample with Coronin1B overexpression was included. Total MYPT-1 and actin immunoblots are shown as loading controls; the expression of myc-SSH1L or V5-Coronin1B is indicated by immunoblotting for the respective epitope tags. B, blots from A are quantified. Bars represent the average ± S.E. (error bars) from three independent experiments. C, cells were treated with control and SSH1L siRNA and then transfected with myc-GFP or V5-Coronin1B. Levels of phosphorylated MYPT-1 and cofilin were assessed by Western blotting. Lane 2 shows that knockdown of SSH1L increases p-MYPT-1 compared with control siRNA-treated cells (lane 1). Lane 4 shows that knockdown of SSH1L prevents inhibition of MYPT-1 phosphorylation when V5-Coronin1B is overexpressed (compared with lane 3). D, blots from C were quantified. Bars represent the average ± S.E. from three independent experiments. E, quantitation of relative expression of SSH1L detected by quantitative PCR is shown. F, MCF7-CXCR4 GFP or GFP-Coronin1B cells treated with control or SSH1L siRNA were analyzed by immunofluorescence microscopy for p-MLC (red) and actin (gray), and GFP fluorescence is shown. Collectively, these data demonstrate that SSH1L is required for Coronin1B to attenuate ROCK signaling to myosin. Scale bar, 10 μm.
FIGURE 7.
FIGURE 7.
Coronin1B is required for NRG-1-mediated inhibition of ROCK signaling to myosin for cell scattering. A, MCF7-CXCR4 cells treated with NRG-1 and levels of p-MYPT-1 and p-MLC were assessed by immunoblotting (IB). B, blots from A were quantified. Bars represent the average ± S.E. (error bars) from three independent experiments. C, MCF7-CXCR4 cells expressing GFP-ROCK2(WT) or GFP-ROCK2(A) were treated with NRG-1 for 40 min and immunoprecipitated (IP) with anti-GFP antibody or control IgG, and co-immunoprecipitation of Coronin1B was measured by immunoblotting. D, MCF7-CXCR4 cells expressing GFP-PH(WT) or GFP-PH(A) or myc-GFP control were treated with NRG-1 for 60 min, and p-MYPT-1 levels were determined by immunoblotting. E, MCF7-CXCR4 cells treated with control or Coronin1B siRNA were treated with NRG-1 for 120 min, and time lapse phase contrast pictures were taken every 5 min. To test whether increased ROCK signaling prevents cell scattering by NRG-1 in Coronin1B knockdown cells, the cells were treated with H1152. F, quantitation of the percent increase in the area of the cell cluster is shown in the graph. The bars represent the average ± S.E. from three independent experiments. G, MCF7-CXCR4 cells were treated with control or Coronin1B siRNA and then stimulated with NRG-1 and analyzed by immunofluorescence microscopy, as in Fig. 3. To determine the dependence on ROCK activity, cells were pretreated with H1152. H, micrographs from G were quantified. Bars represent the average ± S.E. from three independent experiments. Scale bar, 10 μm.

Similar articles

Cited by

References

    1. Kholodenko B. N. (2006) Cell-signalling dynamics in time and space. Nat. Rev. Mol. Cell. Biol. 7, 165–176 - PMC - PubMed
    1. Fischer O. M., Hart S., Gschwind A., Ullrich A. (2003) EGFR signal transactivation in cancer cells. Biochem. Soc. Trans. 31, 1203–1208 - PubMed
    1. Gray S. G., Stenfeldt Mathiasen I., De Meyts P. (2003) The insulin-like growth factors and insulin-signaling systems: an appealing target for breast cancer therapy? Horm. Metab. Res. 35, 857–871 - PubMed
    1. Yarden Y., Sliwkowski M. X. (2001) Untangling the ErbB signalling network. Nat. Rev. Mol. Cell. Biol. 2, 127–137 - PubMed
    1. Sahai E., Olson M. F., Marshall C. J. (2001) Cross-talk between Ras and Rho signalling pathways in transformation favours proliferation and increased motility. EMBO J. 20, 755–766 - PMC - PubMed

Publication types

LinkOut - more resources