. 2012 May 3:6:119.
doi: 10.3389/fnhum.2012.00119. eCollection 2012.

Improving standards in brain-behavior correlation analyses

Affiliations

Improving standards in brain-behavior correlation analyses

Guillaume A Rousselet et al. Front Hum Neurosci. .

Abstract

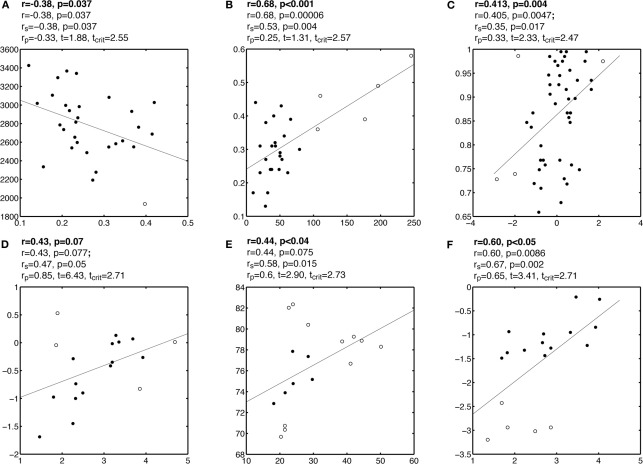
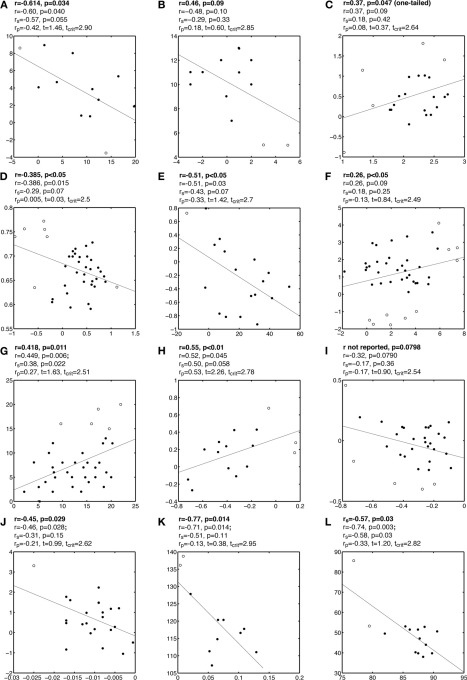
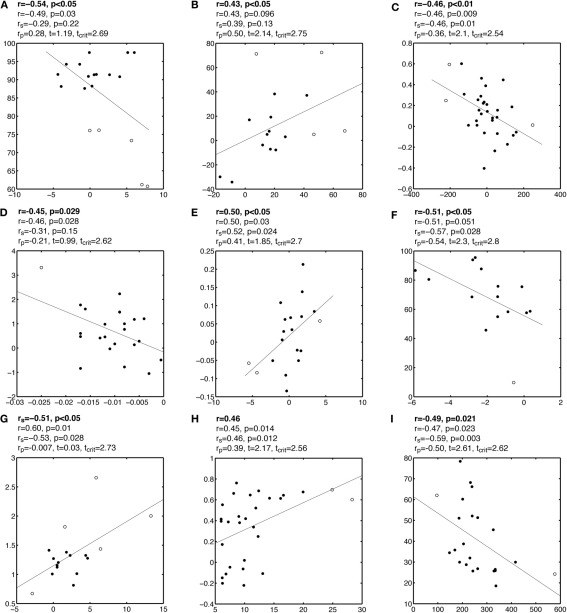
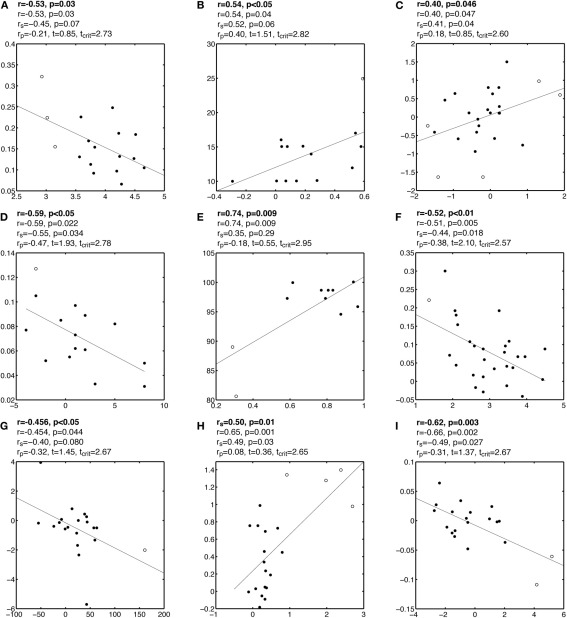
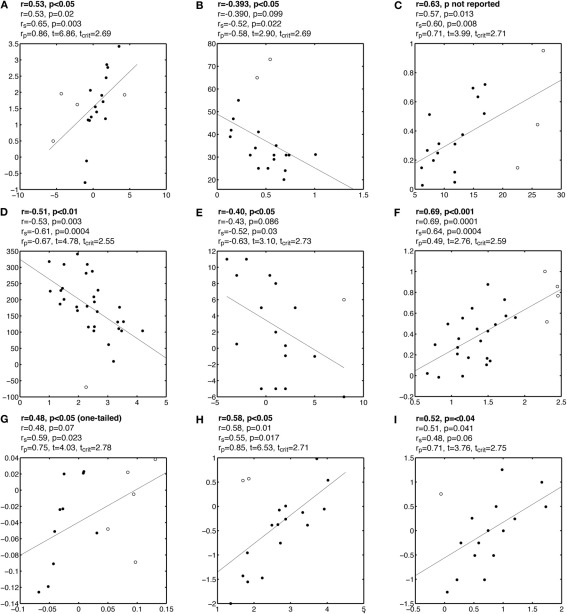
Associations between two variables, for instance between brain and behavioral measurements, are often studied using correlations, and in particular Pearson correlation. However, Pearson correlation is not robust: outliers can introduce false correlations or mask existing ones. These problems are exacerbated in brain imaging by a widespread lack of control for multiple comparisons, and several issues with data interpretations. We illustrate these important problems associated with brain-behavior correlations, drawing examples from published articles. We make several propositions to alleviate these problems.

Keywords: Pearson correlation; Spearman correlation; confidence intervals; multiple comparisons; multivariate statistics; outliers; robust statistics; skipped correlation.


Figures

Figure 1
Figure 1
Examples of Pearson and Spearman correlations. In each subplot, r is Pearson correlation, rs is Spearman correlation, and rp is a skipped correlation. Potential univariate and bivariate outliers are marked by circles and other points marked by disks. A skipped correlation is significant if t is larger than tcrit.
Figure 2
Figure 2
Questionable correlations observed in published articles. Each subplot contains a reproduction of the original data and regression line. Outliers are marked by circles and other points marked by disks. Analyses are reported above each subplot: the first line contains the correlation reported by the authors; the second line contains the Pearson correlation r from our analyses; the third line contains Spearman correlation rs; the fourth line contains the skipped correlation rp. Subplots A, B, C illustrate correlations that could be due to outliers. Subplot D illustrates a potential case of masking. Subplots E and F show the potentially incorrect use of correlation for what could be split data clouds.
Figure A1
Figure A1
Examples of false correlations potentially due to outliers. Each subplot contains a regression line and a scatterplot with outliers marked by circles and other points marked by disks. Analyses are reported above each subplot: the first line contains the Pearson or Spearman correlation reported by the authors; the second line contains the Pearson correlation we obtained; the third line contains Spearman correlation rs; the fourth line contains the skipped correlation rp.
Figure A2
Figure A2
Examples of false correlations potentially due to outliers. See Figure A1 caption for details.
Figure A3
Figure A3
Examples of false correlations potentially due to outliers. See Figure A1 caption for details.
Figure A4
Figure A4
Examples of correlations potentially masked by outliers. See Figure A1 caption for details.
Figure A5
Figure A5
Examples of false correlations potentially due to split data clouds. See Figure A1 caption for details.

References

    1. Barnett V., Lewis T. (1994). Outliers in Statistical Data. Chichester: Wiley
    1. Blyth C. R. (1972). Simpsons paradox and sure-thing principle. J. Am. Stat. Assoc. 67, 364
    1. Forstmann B. U., Anwander A., Schafer A., Neumann J., Brown S., Wagenmakers E.-J., Bogacz R., Turner R. (2010). Cortico-striatal connections predict control over speed and accuracy in perceptual decision making. Proc. Natl. Acad. Sci. U.S.A. 107, 15916–15920 10.1073/pnas.1004932107 - DOI - PMC - PubMed
    1. Goodman S. N. (1999). Toward evidence-based medical statistics. 1, The P value fallacy. Ann. Intern. Med. 130, 995–1004 - PubMed
    1. Hubert M., Rousseeuw P. J., van Aelst S. (2008). High-breakdown robust multivariate methods. Stat. Sci. 23, 92–119

LinkOut - more resources