. 2012;7(4):e35182.
doi: 10.1371/journal.pone.0035182. Epub 2012 Apr 26.

The neutrophil's eye-view: inference and visualisation of the chemoattractant field driving cell chemotaxis in vivo

Affiliations

The neutrophil's eye-view: inference and visualisation of the chemoattractant field driving cell chemotaxis in vivo

Visakan Kadirkamanathan et al. PLoS One. 2012.

Abstract

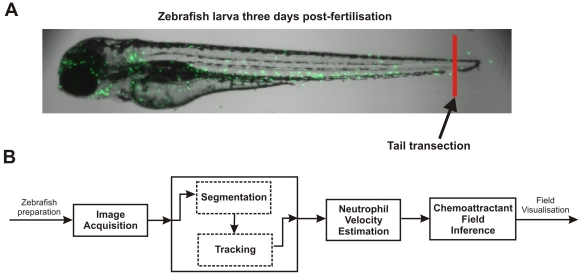
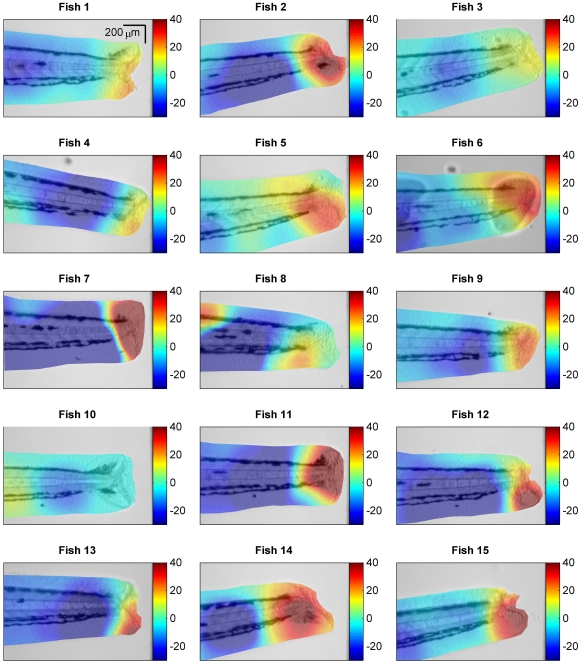
As we begin to understand the signals that drive chemotaxis in vivo, it is becoming clear that there is a complex interplay of chemotactic factors, which changes over time as the inflammatory response evolves. New animal models such as transgenic lines of zebrafish, which are near transparent and where the neutrophils express a green fluorescent protein, have the potential to greatly increase our understanding of the chemotactic process under conditions of wounding and infection from video microscopy data. Measurement of the chemoattractants over space (and their evolution over time) is a key objective for understanding the signals driving neutrophil chemotaxis. However, it is not possible to measure and visualise the most important contributors to in vivo chemotaxis, and in fact the understanding of the main contributors at any particular time is incomplete. The key insight that we make in this investigation is that the neutrophils themselves are sensing the underlying field that is driving their action and we can use the observations of neutrophil movement to infer the hidden net chemoattractant field by use of a novel computational framework. We apply the methodology to multiple in vivo neutrophil recruitment data sets to demonstrate this new technique and find that the method provides consistent estimates of the chemoattractant field across the majority of experiments. The framework that we derive represents an important new methodology for cell biologists investigating the signalling processes driving cell chemotaxis, which we label the neutrophils eye-view of the chemoattractant field.


Conflict of interest statement

Competing Interests: The authors have declared that no competing interests exist.

Figures

Figure 1
Figure 1. Zebrafish experimental setup and neutrophil analysis procedure.
A: Zebrafish larva from the transgenic line, Tg(mpx:GFP)i114. Neutrophils are visualised by excitation of green fluorescent protein, as previously described (Renshaw et al., 2006). The zebrafish were prepared by transection of the tailfin at the site indicated to elicit an inflammatory response, which caused recruitment of the neutrophils to the site of injury. B: The chemoattractant field inference framework. Firstly, images of neutrophil recruitment to the zebrafish wound site were acquired by video microscopy. The neutrophil centroid positions were then obtained from a segmentation and tracking algorithm. Velocities of the neutrophils were estimated from the neutrophil centroid tracks using a Kalman smoother and lastly, the velocity estimates were used in the inference of the chemoattractant field.
Figure 2
Figure 2. Neutrophil centroid position tracks.
The neutrophil tracks (colour lines) were obtained from a segmentation and tracking algorithm and are shown here in relation to the zebrafish image (greyscale), where the zebrafish image of dimension 1000formula image1000 pixels has been zoomed on the vertical axis to the 100–900 pixel range.
Figure 3
Figure 3. Typical examples of neutrophil tracks and neutrophil velocity estimates.
A and D: The image on the left shows a highlighted red track that is zoomed in the plot on the right, in which the centroid positions extracted from the tracking algorithm (black) and smoothed track estimate (red) are compared (the open circle indicates the track start point and the filled circle indicates the track end point). B and E: X-Y cell centroid position estimates corresponding to tracks highlighted in A and B are shown as signals with respect to time produced by the tracking algorithm (black) and estimates from the smoothing algorithm (red). C and F: X-Y velocity estimates (raw estimates in black and smoothed estimates in red), corresponding to position signals in B and E. Raw estimates of velocity were obtained by numerical differencing (central difference method) applied to the tracker position estimates.
Figure 4
Figure 4. Neutrophil velocities.
A: Histogram of neutrophil velocities in the X-direction at each sample time (histograms are zoomed to the −10 to 10 formula image
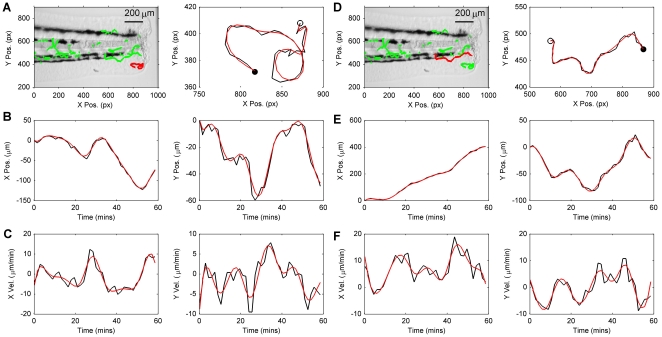
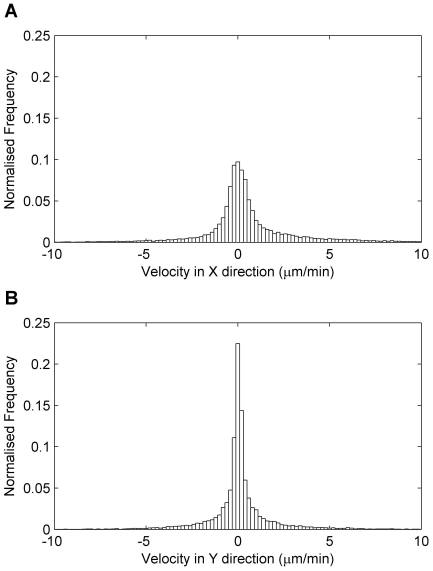
m/min range for an effective visualisation and data are aggregated over all fish). B: Histogram of neutrophil velocities in the Y-direction.
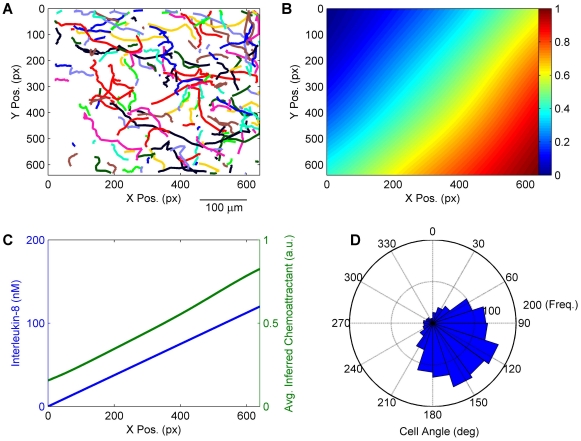
Figure 5
Figure 5. Chemoattractant field inference in vitro.
A: Cell tracks of human neutrophils in vitro chemotaxing due to presence of the chemokine interleukin-8, which increases in concentration from left to right. B: Inferred chemoattractant field, normalised to the range (0,1). The chemoattractant field estimate is dimensionless hence the scale of the colormap is in arbitrary units (a.u.). C: Comparison of inferred chemoattractant field averaged over the Y-direction, to the level of chemokine interleukin-8 reported in . D: Circular histogram of neutrophil angles, demonstrating a directional bias of the tracks shown in panel A towards the lower right corner.
Figure 6
Figure 6. Chemoattractant field inference in the zebrafish.
For each zebrafish, 1–15, the estimate of the chemoattractant field (colour) is overlayed with transparency on the fish image (grayscale). Each colormap is scaled to the range −20 to 40 to provide an effective visual comparison over all fish. The chemoattractant field estimate is dimensionless hence the scale of the colormap is in arbitrary units.

Similar articles

Cited by

References

    1. Porter SL, Wadhams GH, Armitage JP. Signal processing in complex chemotaxis pathways. Nature Reviews Microbiology. 2011;9:153–165. - PubMed
    1. Swaney KF, Huang C, Devreotes PN. Eukaryotic chemotaxis: a network of signaling pathways controls motility, directional sensing, and polarity. Annual Review of Biophysics. 2010;39:265–289. - PMC - PubMed
    1. Parent CA. Making all the right moves: chemotaxis in neutrophils and dictyostelium. Current Opinion in Cell Biology. 2004;16:4–13. - PubMed
    1. Nathan C. Neutrophils and immunity: challenges and opportunities. Nature Reviews Immunology. 2006;6:173–182. - PubMed
    1. Silva MT. Macrophage phagocytosis of neutrophils at inammatory/infectious foci: a cooperative mechanism in the control of infection and infectious inammation. Journal of Leukocyte Biology. 2011;89:675–683. - PubMed

Publication types

Substances