. 2012;7(4):e35785.
doi: 10.1371/journal.pone.0035785. Epub 2012 Apr 26.

Kidins220/ARMS is a novel modulator of short-term synaptic plasticity in hippocampal GABAergic neurons

Affiliations

Kidins220/ARMS is a novel modulator of short-term synaptic plasticity in hippocampal GABAergic neurons

Joachim Scholz-Starke et al. PLoS One. 2012.

Abstract

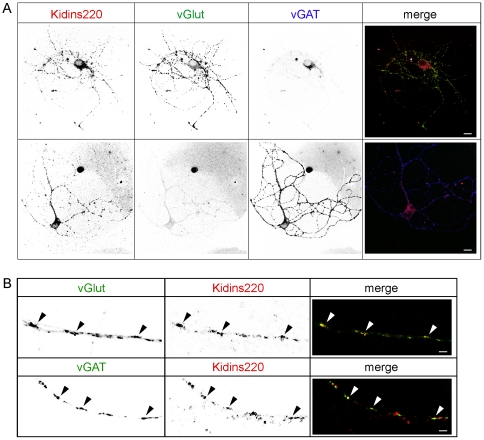
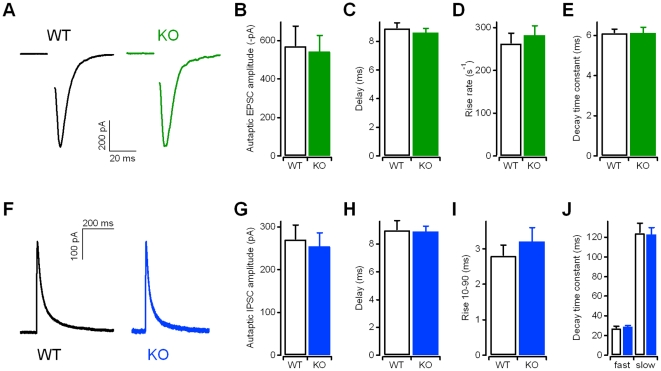
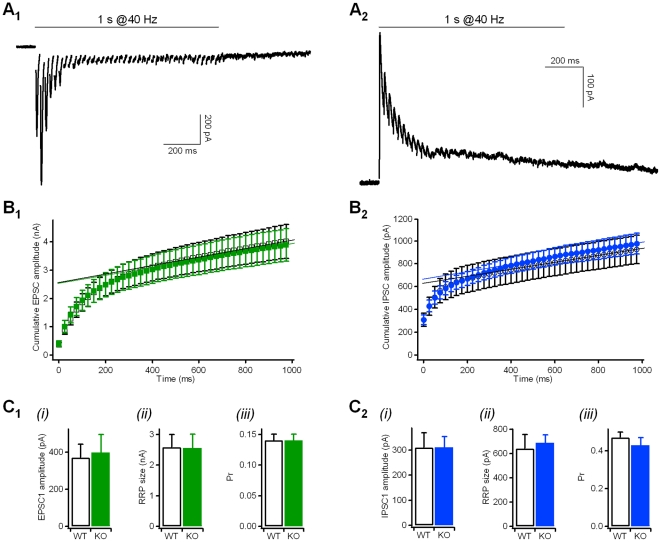
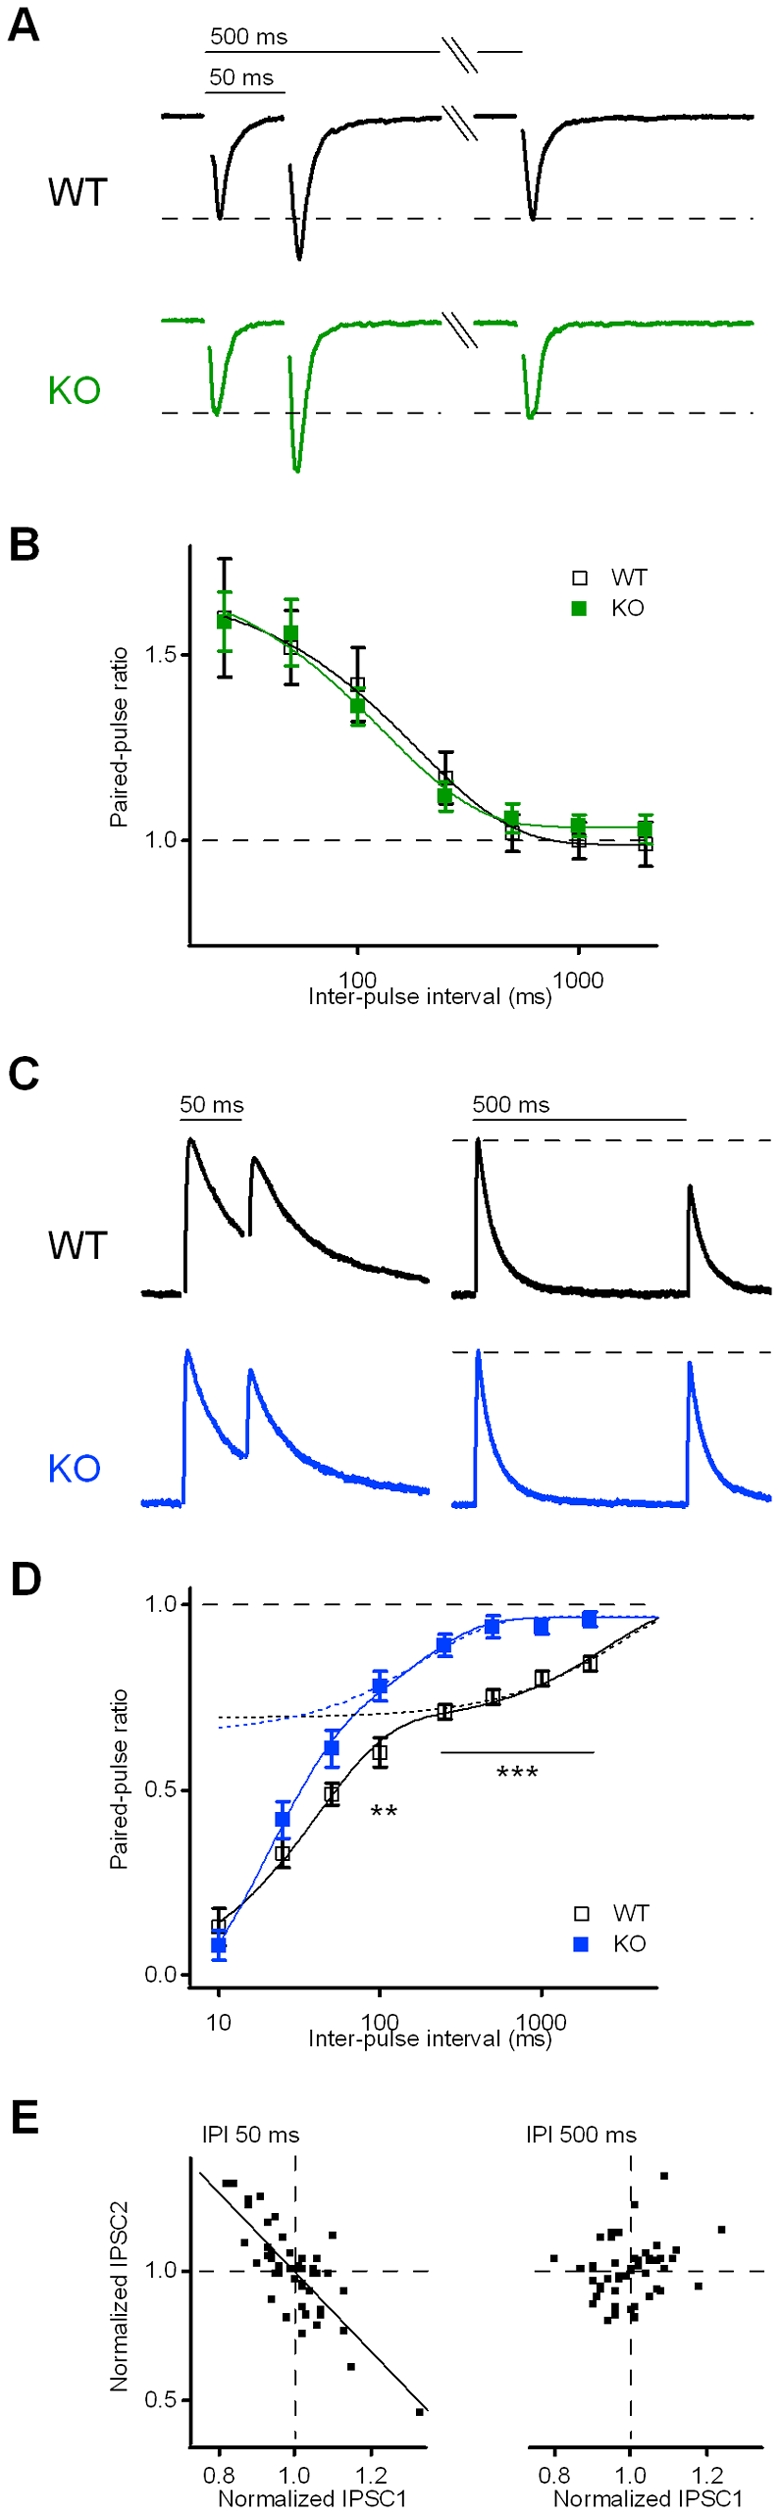
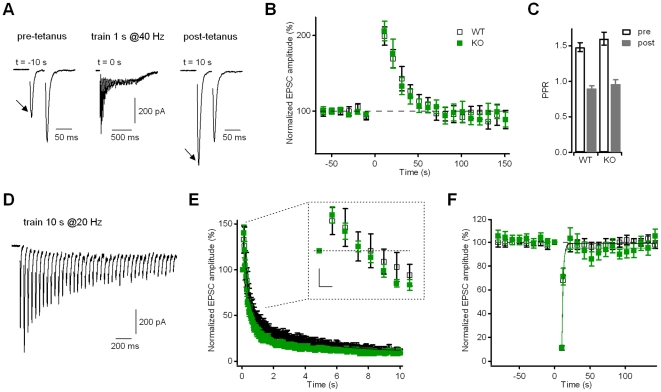
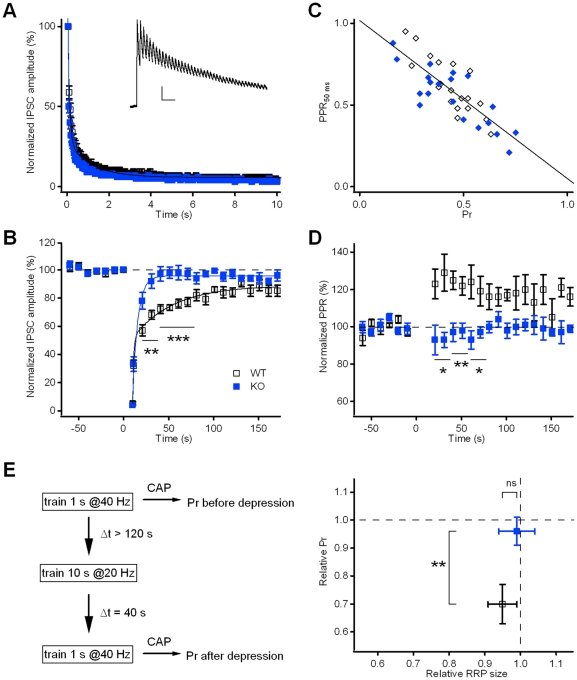
Kidins220 (Kinase D interacting substrate of 220 kDa)/ARMS (Ankyrin Repeat-rich Membrane Spanning) is a scaffold protein highly expressed in the nervous system. Previous work on neurons with altered Kidins220/ARMS expression suggested that this protein plays multiple roles in synaptic function. In this study, we analyzed the effects of Kidins220/ARMS ablation on basal synaptic transmission and on a variety of short-term plasticity paradigms in both excitatory and inhibitory synapses using a recently described Kidins220 full knockout mouse. Hippocampal neuronal cultures prepared from embryonic Kidins220(-/-) (KO) and wild type (WT) littermates were used for whole-cell patch-clamp recordings of spontaneous and evoked synaptic activity. Whereas glutamatergic AMPA receptor-mediated responses were not significantly affected in KO neurons, specific differences were detected in evoked GABAergic transmission. The recovery from synaptic depression of inhibitory post-synaptic currents in WT cells showed biphasic kinetics, both in response to paired-pulse and long-lasting train stimulation, while in KO cells the respective slow components were strongly reduced. We demonstrate that the slow recovery from synaptic depression in WT cells is caused by a transient reduction of the vesicle release probability, which is absent in KO neurons. These results suggest that Kidins220/ARMS is not essential for basal synaptic transmission and various forms of short-term plasticity, but instead plays a novel role in the mechanisms regulating the recovery of synaptic strength in GABAergic synapses.


Conflict of interest statement

Competing Interests: The authors have declared that no competing interests exist.

Figures

Figure 1
Figure 1. Immunocytochemical analyses showed similar Kidins220 expression and pre-synaptic localization in excitatory and inhibitory autaptic neurons.
A) Immunofluorescence images of a glutamatergic (vGlut-positive) and a GABAergic (vGAT-positive) autaptic neuron stained with anti-Kidins220 (red), anti-vGlut1 (green) and anti-vGAT (blue) antibodies. Merged images are shown on the right. Scale bars, 10 µm. B) Higher magnification of excitatory and inhibitory neuronal processes stained with anti-Kidins220 (red) and anti-vGlut or anti-vGAT (green) antibodies. Merged images are shown on the right. Kidins220 shows a good co-localization with both pre-synaptic markers (arrowheads), indicating pre-synaptic localization of the protein in both excitatory and inhibitory terminals. Scale bars, 1 µm.
Figure 2
Figure 2. Excitatory and inhibitory post-synaptic currents recorded from autaptic Kidins220−/− neurons showed normal amplitudes and kinetics.
A) Representative eEPSC recordings in WT and KO autaptic neurons in response to brief depolarization. Stimulus transients have been removed for clarity. Holding potential −86 mV. B) eEPSC amplitudes recorded from autaptic neurons (n = 52 for WT; n = 45 for KO). C) Delay times were determined as the time between the stimulus and the peak of the EPSC response. D) The rise rate as a measure of the activation kinetics was determined from the slope of the EPSC's rising phase. E) The time constant of EPSC deactivation was determined by fitting the EPSC decay phase with a mono-exponential function. F) Representative eIPSC recordings in WT and KO neurons in response to brief depolarization. Stimulus transients have been removed for clarity. Holding potential −66 mV. G) eIPSC amplitudes recorded from autaptic neurons (n = 36 for WT; n = 29 for KO). H) Delay times were determined as the time between the stimulus and the peak of the IPSC response. I) The rise time (from 10% to 90% of the IPSC amplitude) was determined from the rising phase of IPSC. J) Fast and slow time constants of IPSC deactivation were determined by fitting the IPSC decay phase with a bi-exponential function. For the data in C–E and H–J, n = 20 for both WT and KO. None of the analyses revealed significant differences (p>0.05; unpaired Student's t-test). See the Methods section for details on the determination of current kinetics.
Figure 3
Figure 3. Cumulative amplitude profile analyses did not reveal differences in RRP sizes and vesicle release probabilities between wild type and Kidins220−/− neurons.
A) Representative current traces (EPSCs in A1; IPSCs in A2) in response to a 1-s stimulation train at 40 Hz. Holding potential −86 mV in A1, −66 mV in A2. B) Cumulative amplitude profile of EPSCs (B1) and IPSCs (B2) during repetitive stimulation at 40 Hz for 1 s (see current traces in A). Currents were recorded from autaptic neurons, with n = 16 WT (open squares), n = 15 KO (filled squares) for EPSC data, and n = 13 WT (open circles), n = 16 KO (filled circles) for IPSC data. Data points between 600 and 1,000 ms were subjected to a line fit to estimate the size of the cumulative EPSC/IPSC amplitude before steady-state depression (see below). C) The parameters derived from the cumulative amplitude profile analyses in B did not differ between WT and KO neurons (p>0.05; unpaired Student's t-test): (i) the amplitude of the first autaptic EPSC (C1) and IPSC (C2) in the train; (ii) the cumulative current amplitude before steady-state depression (indicating the size of the readily releasable pool (RRP)) estimated from the intercept of the line fit (in B) at t = 0 s; (iii) the vesicle release probability (Pr) calculated as the ratio between EPSC1/IPSC1 (see i) and the respective RRP size (see ii).
Figure 4
Figure 4. Neurons from Kidins220−/− mice showed normal EPSC paired-pulse facilitation, but reduced IPSC paired-pulse depression at long inter-pulse intervals.
A) Representative EPSC recordings in WT and KO autaptic neurons in response to paired stimuli separated by the indicated inter-pulse interval. Holding potential −86 mV. B) In EPSC recordings, paired-pulse protocols were applied at a stimulation frequency of 0.1 Hz, with inter-pulse intervals ranging from 25 to 2,000 ms. The paired-pulse ratio was calculated as the ratio between the second and the first amplitude, n = 11–14 for WT (open symbols) and n = 10–14 for KO (filled symbols). There was no significant difference between WT and KO cells (p>0.05; unpaired Student's t-test). Continuous lines represent best fits with a mono-exponential function. C) Representative IPSC recordings in WT and KO neurons in response to paired stimuli separated by the indicated inter-pulse interval. Holding potential −66 mV. D) In IPSC recordings, paired-pulse protocols were applied at a stimulation frequency of 0.1 Hz, with inter-pulse intervals ranging from 10 to 2,000 ms, n = 13–25 for WT (open symbols) and n = 14–22 for KO (filled symbols). Continuous lines represent best fits with a bi-exponential function, dotted lines indicate the slow component of the fit. E) The slow component of PPD in WT neurons appears to be independent of previous release. IPSC2 is plotted against IPSC1 for individual trials of paired-pulse stimulation. For each cell (n = 7; WT), individual IPSC amplitudes were normalized to the mean value of the recorded ensemble. The data set at IPI = 50 ms (left panel; mean PPR = 0.49) revealed an inverse relationship between IPSC amplitudes (r = −0.80; p<0.001; continuous line represents linear regression), while the data set at IPI = 500 ms (right panel; mean PPR = 0.72) for the same cells showed no such correlation (r = 0.25; p>0.05).
Figure 5
Figure 5. Neurons from Kidins220−/− mice showed normal post-tetanic potentiation and synaptic depression of evoked EPSCs.
A) EPSCs recorded using a paired-pulse protocol (IPI = 50 ms) are presented before (left trace) and after (right trace) the application of a 1-s stimulation train at 40 Hz (middle trace). The increase of the EPSC1 amplitude (arrows) is connected to a decrease of the paired-pulse ratio. Holding potential −86 mV. B) Time course of post-synaptic currents (in % of baseline) recorded at a stimulation frequency of 0.1 Hz. Tetanic stimulation (as in A) was applied at t = 0 s. EPSCs displayed post-tetanic potentiation with a peak at 10 s after the end of tetanic stimulation. There was no significant difference between WT and KO cells (n = 22 for both groups; p>0.05, unpaired Student's t-test). C) The paired-pulse ratio of EPSC recordings for both WT and KO neurons (n = 22 for both groups; p>0.05, unpaired Student's t-test) changes from facilitation in the baseline condition (pre) to depression at the 10-s time point after tetanic stimulation (post). D) Representative EPSC trace in response to a 10-s stimulation train at 20 Hz to induce synaptic depression. Only the first 2 s corresponding to 40 pulses are shown for clarity. Holding potential −86 mV. E) Time course of EPSC responses during the application of a 10 s @20 Hz train. Data were normalized to the amplitude of the first current response in the train. There was no significant difference between WT and KO cells (n = 16 for both groups; p>0.05, unpaired Student's t-test). Continuous lines represent best fits with a bi-exponential function. The inset illustrates the transient increase of the EPSC amplitude during the first pulses of the train on an expanded scale. Scale bars 50 ms/20%. F) Recovery from depression of EPSC responses was followed at a stimulation frequency of 0.1 Hz. All data points were normalized to the amplitude of the first current response in the train (applied at time point 0). There was no significant difference between WT and KO cells (p>0.05, unpaired Student's t-test). Lines represent best-fits with a mono-exponential function.
Figure 6
Figure 6. Neurons from Kidins220−/− mice showed normal train-induced depression of IPSCs, but faster recovery from depression.
A) Time course of IPSC responses during the application of a 10-s stimulation train at 20 Hz to induce synaptic depression. Data were normalized to the amplitude of the first current response in the train, n = 15 for WT and n = 11 for KO. There was no significant difference between WT and KO cells (p>0.05; unpaired Student's t-test). Lines represent best-fits with a bi-exponential function. The inset shows a representative current trace (only the first 2 s corresponding to 40 pulses are shown for clarity). Scale bars 100 pA/200 ms. Holding potential −66 mV. B) Recovery from depression of IPSC responses was followed at a stimulation frequency of 0.1 Hz. All data points were normalized to the amplitude of the first current response in the train (applied at time point 0). Lines represent best-fits with a bi-exponential function. C) Inverse relationship between the paired-pulse ratio (IPI = 50 ms) of baseline IPSC recordings immediately before tetanic stimulation and the vesicle release probability (Pr), obtained from cumulative amplitude profile analyses (see Figure 3). Pooled data points from 20 WT cells (open diamonds) and 20 KO cells (closed diamonds) were fitted with a linear function (continuous line; slope −0.97; r = −0.80; p<0.001). D) Time course of the paired-pulse ratio (PPR; IPI = 50 ms) of IPSC recordings. The PPR at every time point was normalized to the mean PPR before the stimulation train (applied at time point 0), n = 9 for WT and n = 8 for KO. E) Experimental scheme (left panel) illustrating the application of 1-s stimulation trains at 40 Hz before synaptic depression and during recovery from depression to estimate Pr using cumulative amplitude profile (CAP) analysis. Relative changes of Pr and RRPsyn for 8 WT cells (baseline Pr 0.45) and 4 KO cells (baseline Pr 0.47) are shown in the right panel.

References

    1. Zucker RS, Regehr WG. Short-term synaptic plasticity. Annu Rev Physiol. 2002;64:355–405. - PubMed
    1. Poo MM. Neurotrophins as synaptic modulators. Nat Rev Neurosci. 2001;2:24–32. - PubMed
    1. Gottmann K, Mittmann T, Lessmann V. BDNF signaling in the formation, maturation and plasticity of glutamatergic and GABAergic synapses. Exp Brain Res. 2009;199:203–234. - PubMed
    1. Iglesias T, Cabrera-Poch N, Mitchell MP, Naven TJ, Rozengurt E, et al. Identification and cloning of Kidins220, a novel neuronal substrate of protein kinase D. J Biol Chem. 2000;275:40048–40056. - PubMed
    1. Kong H, Boulter J, Weber JL, Lai C, Chao MV. An evolutionarily conserved transmembrane protein that is a novel downstream target of neurotrophin and ephrin receptors. J Neurosci. 2001;21:176–185. - PMC - PubMed

Publication types