. 2012;7(4):e35868.
doi: 10.1371/journal.pone.0035868. Epub 2012 Apr 26.

Estimation of fish biomass using environmental DNA

Affiliations

Estimation of fish biomass using environmental DNA

Teruhiko Takahara et al. PLoS One. 2012.

Abstract

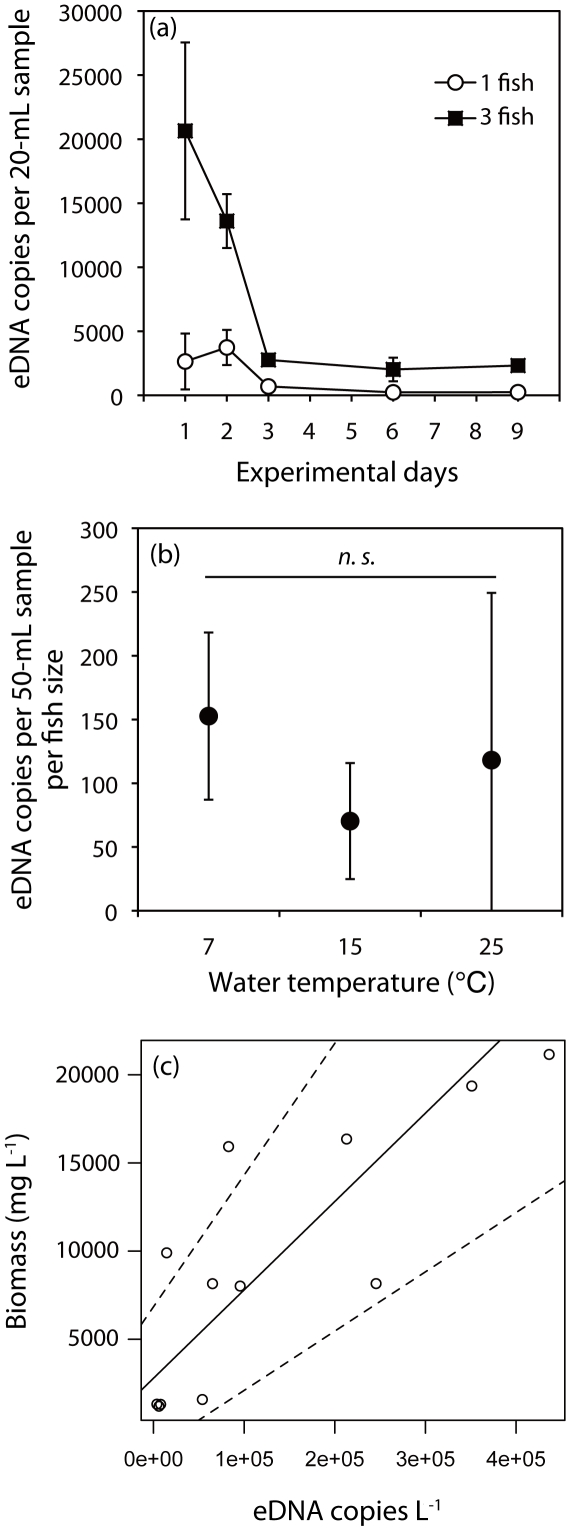
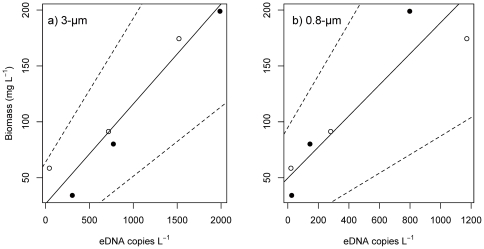
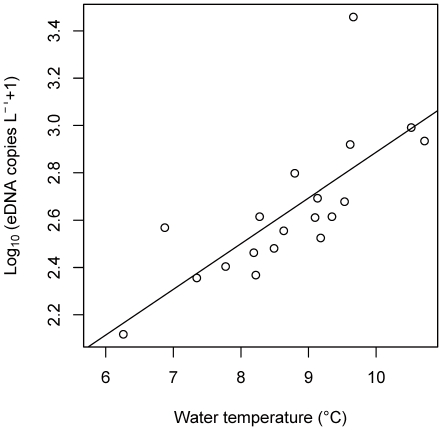
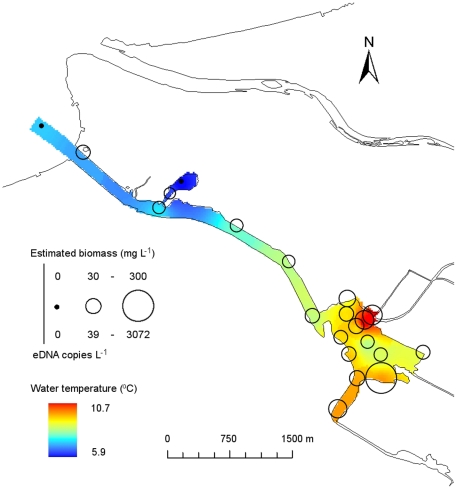
Environmental DNA (eDNA) from aquatic vertebrates has recently been used to estimate the presence of a species. We hypothesized that fish release DNA into the water at a rate commensurate with their biomass. Thus, the concentration of eDNA of a target species may be used to estimate the species biomass. We developed an eDNA method to estimate the biomass of common carp (Cyprinus carpio L.) using laboratory and field experiments. In the aquarium, the concentration of eDNA changed initially, but reached an equilibrium after 6 days. Temperature had no effect on eDNA concentrations in aquaria. The concentration of eDNA was positively correlated with carp biomass in both aquaria and experimental ponds. We used this method to estimate the biomass and distribution of carp in a natural freshwater lagoon. We demonstrated that the distribution of carp eDNA concentration was explained by water temperature. Our results suggest that biomass data estimated from eDNA concentration reflects the potential distribution of common carp in the natural environment. Measuring eDNA concentration offers a non-invasive, simple, and rapid method for estimating biomass. This method could inform management plans for the conservation of ecosystems.


Conflict of interest statement

Competing Interests: The authors have read the journal's policy. Dr. Y. Iseri is working for a private company (the West Japan Engineering Consultants, Inc.). The RIHN possessed all the data and materials, because the RIHN and his company were making a contract of research support. Thus, this does not alter the authors' adherence to all the PLoS ONE policies on sharing data and materials.

Figures

Figure 1
Figure 1. Relationships between the concentration of environmental DNA (eDNA) of common carp and three factors (duration, water temperature, and biomass) in aquarium experiments.
(a) Time-dependent change in eDNA concentration at two biomass levels (one or three fish per tank). The error bars represent ±1 SD. (b) Effect of temperature on eDNA concentrations 6 d after introduction of fish to the tank. “n.s." indicates no significant differences. The error bars represent ±1 SD. (c) Relationship between eDNA concentration and carp biomass per 1-L water 6 d after introduction of fish to the tank. The regression was significant (p<0.05). Dotted lines represent the lower or upper limits of the 95% confidence intervals for the slope of the regression.
Figure 2
Figure 2. Relationships between the concentration of environmental DNA (eDNA) from common carp and their biomass in the outdoor pond experiment.
The eDNA in the water samples was concentrated using (a) 3.0-µm and (b) 0.8-µm pore-sized filters. The regression line for both filter types showed that there was a positive relationship between eDNA concentration and carp biomass per 1-L water (see Results). Dotted lines represent the lower or upper limits of the 95% confidence intervals for the slope of the regression. The open and closed circles represent data from ponds A and B, respectively.
Figure 3
Figure 3. Relationships between concentration of environmental DNA (eDNA) from common carp and water temperature in Iba-naiko lagoon.
The regression line showed a significant trend by GLM (p<0.05, see Results).
Figure 4
Figure 4. Estimates of carp biomass based on the concentration of environmental DNA (eDNA) in Iba-naiko lagoon, Japan.
Estimated carp biomass (calculated from eDNA concentration) and water temperature at each site are represented by the circle size and color gradient, respectively.

Similar articles

Cited by

References

    1. Begon M, Townsend CR, Harper JL. Ecology: from individuals to ecosystems. Hoboken, NJ, USA: Wiley-Blackwell; 2005. 752
    1. Valentini A, Pompanon F, Taberlet P. DNA barcoding for ecologists. Trends Ecol Evol. 2009;24:110–117. - PubMed
    1. Ficetola GF, Miaud C, Pompanon F, Taberlet P. Species detection using environmental DNA from water samples. Biol Lett. 2008;4:423–425. - PMC - PubMed
    1. Jerde CL, Mahon AR, Chadderton WL, Lodge DM. “Sight-unseen" detection of rare aquatic species using environmental DNA. Conserv Lett. 2011;4:150–157.
    1. Goldberg CS, Pilliod DS, Arkle RS, Waits LP. Molecular detection of vertebrates in stream water: a demonstration using rocky mountain tailed frogs and Idaho giant salamanders. PLoS ONE. 2011;6:e22746. - PMC - PubMed

Publication types