. 2012;7(5):e36167.
doi: 10.1371/journal.pone.0036167. Epub 2012 May 1.

Functional evidence of multidrug resistance transporters (MDR) in rodent olfactory epithelium

Affiliations

Functional evidence of multidrug resistance transporters (MDR) in rodent olfactory epithelium

Adrien Molinas et al. PLoS One. 2012.

Abstract

Background: P-glycoprotein (Pgp) and multidrug resistance-associated protein (MRP1) are membrane transporter proteins which function as efflux pumps at cell membranes and are considered to exert a protective function against the entry of xenobiotics. While evidence for Pgp and MRP transporter activity is reported for olfactory tissue, their possible interaction and participation in the olfactory response has not been investigated.

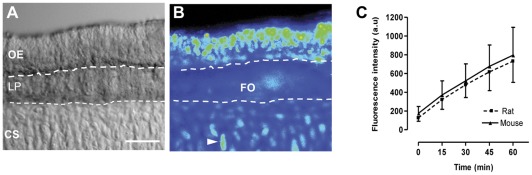
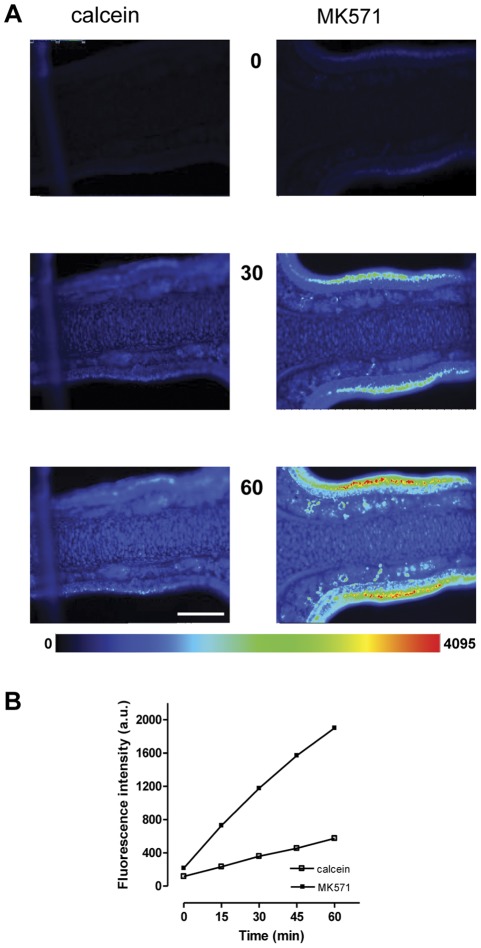
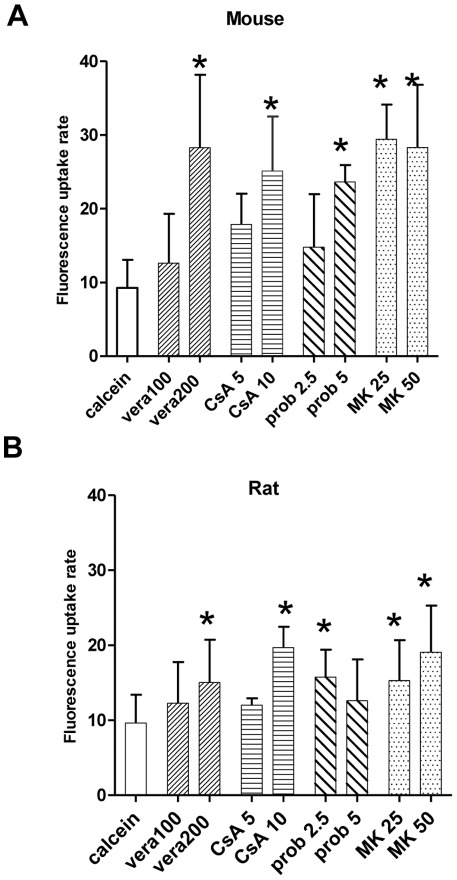
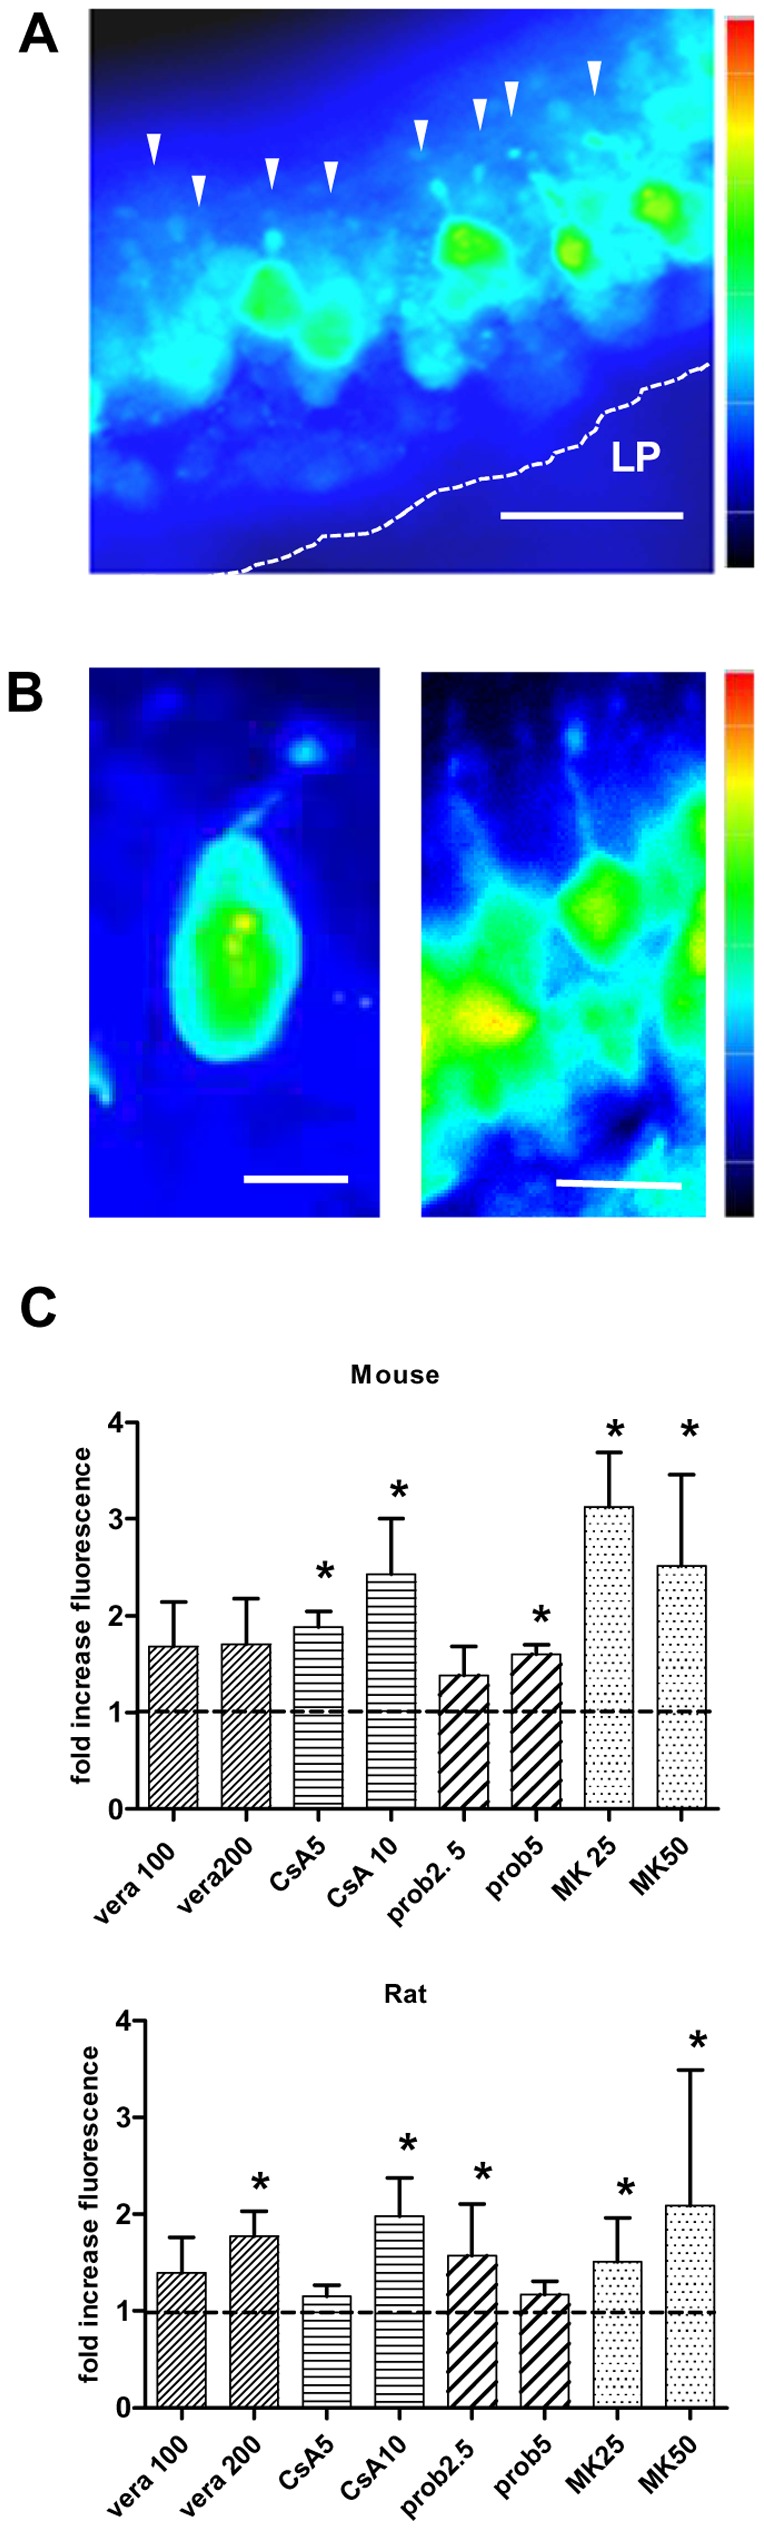
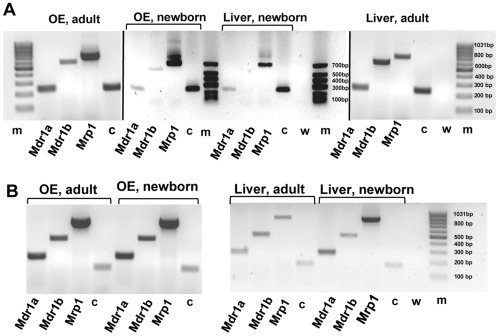
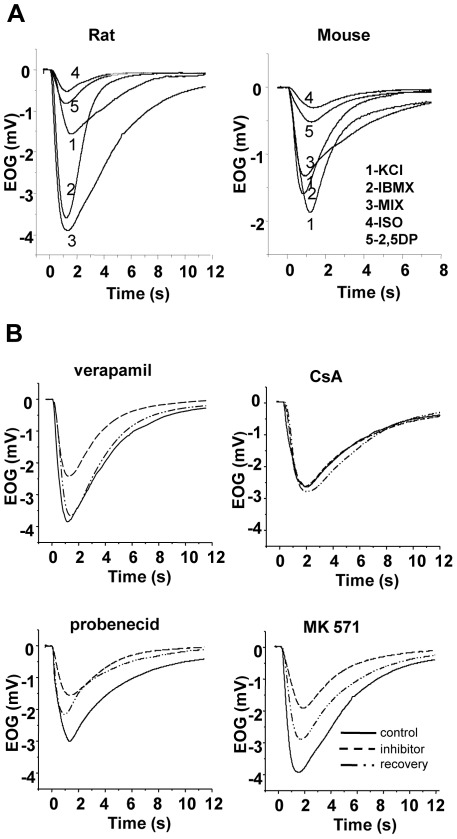
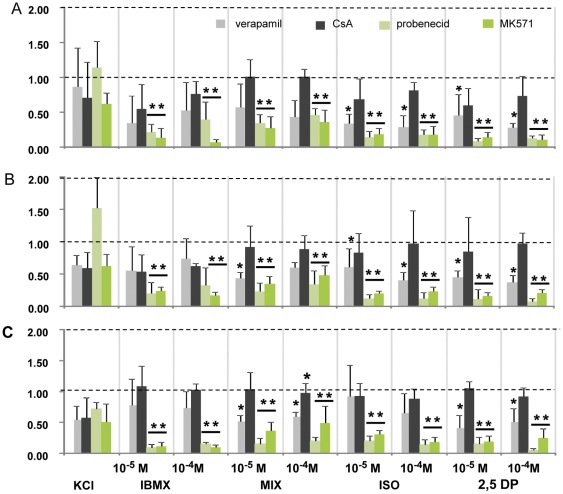
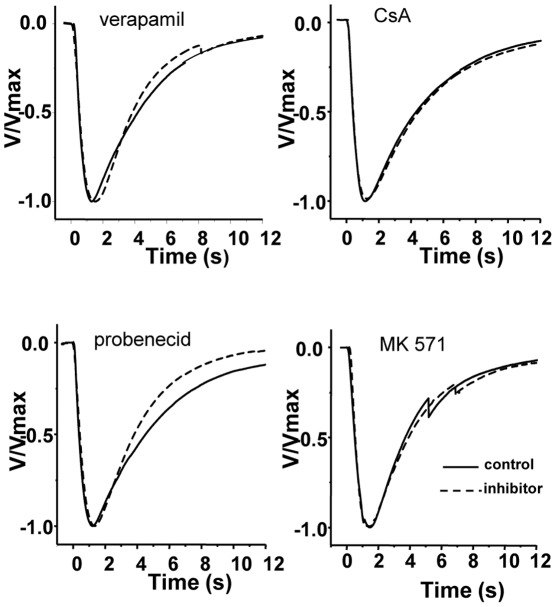
Principal findings: Functional activity of putative MDR transporters was assessed by means of the fluorometric calcein acetoxymethyl ester (calcein-AM) accumulation assay on acute rat and mouse olfactory tissue slices. Calcein-AM uptake was measured as fluorescence intensity changes in the presence of Pgp or MRP specific inhibitors. Epifluorescence microscopy measured time course analysis in the olfactory epithelium revealed significant inhibitor-dependent calcein uptake in the presence of each of the selected inhibitors. Furthermore, intracellular calcein accumulation in olfactory receptor neurons was also significantly increased in the presence of either one of the Pgp or MRP inhibitors. The presence of Pgp or MRP1 encoding genes in the olfactory mucosa of rat and mouse was confirmed by RT-PCR with appropriate pairs of species-specific primers. Both transporters were expressed in both newborn and adult olfactory mucosa of both species. To assess a possible involvement of MDR transporters in the olfactory response, we examined the electrophysiological response to odorants in the presence of the selected MDR inhibitors by recording electroolfactograms (EOG). In both animal species, MRPs inhibitors induced a marked reduction of the EOG magnitude, while Pgp inhibitors had only a minor or no measurable effect.

Conclusions: The findings suggest that both Pgp and MRP transporters are functional in the olfactory mucosa and in olfactory receptor neurons. Pgp and MRPs may be cellular constituents of olfactory receptor neurons and represent potential mechanisms for modulation of the olfactory response.


Conflict of interest statement

Competing Interests: The authors have declared that no competing interests exist.

Figures

Figure 1
Figure 1. Calcein fluorescence pattern and accumulation in olfactory tissue slices of mouse and rat. A:
Transmission light micrograph of a part of a typical coronal section through the main olfactory epithelium of mouse featuring three main layers: the olfactory epithelium (OE), the lamina propria (LP) and the nasal cartilage of the septum (CS). B: Pseudocolored fluorescence image of the same section after 30 minutes of incubation with 1 µM calcein-AM. Note that main staining occurred in the OE, some staining in the LP mainly in the fila olfactoria (FO), and cartilage cells, the chondrocytes (arrowhead). C: Time-dependent changes of calcein accumulation in the OE of rats (n = 19) and mice (n = 16) as determined from average fluorescence intensities of regions of interests (ROIs) at indicated time points. Fluorescence intensity in arbitrary units (a.u), scale bar in A = 50 µm.
Figure 2
Figure 2. Calcein fluorescence in olfactory slices is elevated in the presence of an MDR inhibitor. A:
Time series images in pseudocolor of two individual mouse olfactory slices incubated with 1 µM calcein–AM (left panel), or concomitantly with 25 µM MK571 (right panel). The numbered images correspond to individual frames at indicated time points. Some pixel saturation occurred at the 60 min time point in the center portion of the OE in MK-treated slice. The two slices are from the same specimen, recorded with identical exposure times. B: Time-dependent accumulation of fluorescence intensity (arbitrary units, a.u) for calcein in the absence or presence of 25 µM MK571 as evaluated from regions of interest (ROIs), saturated pixels were not considered for evaluation. Data derived from above experiment. Values of the pseudocolor code bar scales from 0 (low, blue) to 4095 (high, red), scale bar in A = 200 µm.
Figure 3
Figure 3. Effect of various MDR inhibitors on calcein accumulation in olfactory slices of rat and mouse.
Olfactory tissue slices were incubated with 1 µM calcein-AM in the absence or presence of the specific MDR inhibitors. Bars represent average accumulation rates as determined from slopes over all time points of the experiment, in (A) from mice, and in (B) from rats. The following inhibitors were tested: vera  =  verapamil at 100 and 200 µM, CsA  =  cyclosporin A at 5 and 10 µM, prob  =  probenecid at 2.5 and 5 mM, and MK  =  MK571 at 25 and 50 µM. Values from at least three independent assays for each inhibitor and concentration. * p<0.05.
Figure 4
Figure 4. MDR inhibitors enhanced calcein accumulation in olfactory receptor neurons (ORNs) of mouse and rat. A:
Pseudocolored fluorescence micrograph of a part of an olfactory slice from rat in the presence of MK571 (50 µM) at the 60 min time point. Arrowheads point to ORNs appearing as pear-shaped cells with visible knob-bearing dendritic structures. Fluorescence image adjusted for contrast, pseudocolor bar scales from low (blue) to high (red) intensities. LP  =  lamina propria, scale bar in A = 20 μm. B: Fluorescence scaling is different for the two images, the value of the pseudocolor bar scales 0 to 1500 for the left panel and micrograph of a single mouse ORN in the presence of calcein-AM (left panel) and a row of ORNs in the presence of cyclosporin A (right panel). Both images are taken at the 60 min time point. Note, that the 0 to 4095 for the right panel. Scale bar in the left panel = 5 µm, and 10 µm in the right panel. C: Intracellular inhibitor-dependent increase in fluorescence intensities was evaluated from regions of interest (ROIs) placed over the cell bodies of ORNs at the 60 min time point. Bars represent the averaged inhibitor-to-control ratios of calcein fluorescence intensities in mouse (upper panel) and rat (lower panel) for four tested inhibitors: vera  =  verapamil at 100 and 200 µM, CsA  =  cyclosporin A at 5 and 10 µM, prob  =  probenecid at 2.5 and 5 mM, and MK  =  MK571 at 25 and 50 µM. * p<0.05.
Figure 5
Figure 5. Distribution of mdr and mrp mRNAs in rat and mouse olfactory and liver tissue.
The presence of mdr1a, mdr1b and mrp1 mRNA analyzed by means of RT-PCR from samples of olfactory mucosa and liver tissue. Electrophoresis of PCR products A: from newborn and adult rat, B: from newborn and adult mouse. The cDNAs were amplified with rat- and mouse-specific primers for the Mdr1a, Mdr1b and Mrp1 genes. All tissues were positive for the tested cDNAs (note that staining in A, lane 12 for mdr1b is weak, but visible on the gel). c  =  cyclophilin A used as positive control, w  =  negative control containing water in place of cDNA, m = DNA size markers. All gels were run together except for the newborn rat, which was run on a separate gel. Results from a single experiment.
Figure 6
Figure 6. Modulatory effect of MDR inhibitors on the olfactory response to odorants in rat and mouse.
A: Representative superimposed electroolfactogram traces recorded in the septal olfactory mucosa of a rat (left) and a mouse (right) under control conditions. Responses are recorded to a sequence of stimuli (inset, left) as KCl, IBMX, a mixture of odorants, isoamyl acetate and 2,5-dimethyl pyrazine, at concentrations of 10−4 M. B: Representative selection of EOG recordings from rats in response to the mixture at a concentration of 10−4 M before (control, solid line), during (inhibitor, dashed line), and after (recovery, dot-dash line) application of four MDR inhibitors: verapamil at 200 µM, cyclosporin A (CsA) at 5 µM, probenecid at 2.5 mM and MK571 at 25 µM. Recordings are from four different specimen.
Figure 7
Figure 7. Summary of the modulatory effects of four MDR inhibitors on olfactory response amplitudes.
A: in the rat olfactory septum, B: in the rat turbinate, and C: in the mouse olfactory septum. Bars represent normalized average peak amplitudes. Responses were normalized with respect to control before inhibitor application which was set to unity. The following stimuli were sequentially applied in control condition and in presence of the specified inhibitor: KCl, IBMX, a mixture of odorants (MIX), isoamyl acetate (ISO), and 2,5-dimethyl pyrazine (2,5DP), at the indicated concentrations. The inhibitors tested were verapamil at 200 µM (gray), cyclosporin A at 5 µM (black), probenecid at 2.5 mM, (light green) and MK571 at 25 µM (green). Note that for the mouse (in C) the results for 5 mM probenecid are shown. **p<0.001, * p<0.05.
Figure 8
Figure 8. Comparison of the kinetics of olfactory responses during inhibitor application.
Representative electroolfactogram (EOG) traces from rat in response to the odorant mixture of 10−4 M before and during MDR inhibitor application. EOG traces were normalized to their maximum amplitude and averaged for the comparison of their time course. Inhibitors applied were verapamil at 200 µM, CsA  =  cyclosporin A at 5 µM, probenecid at 2.5 mM, and MK571 at 25 µM. Each averaged waveform represents the independent assessment from four different animals.

Similar articles

Cited by

References

    1. Juliano RL, Ling V. A surface glycoprotein modulating drug permeability in Chinese hamster ovary cell mutants. Biochim Biophys Acta. 1976;455:152–162. - PubMed
    1. Cole SP, Bhardwaj G, Gerlach JH, Mackie JE, Grant CE, et al. Overexpression of a transporter gene in a multidrug-resistant human lung cancer cell line. Science. 1992;258:1650–1654. - PubMed
    1. Leslie EM, Deeley RG, Cole SP. Multidrug resistance proteins: role of P-glycoprotein, MRP1, MRP2, and BCRP (ABCG2) in tissue defense. Toxicol Appl Pharmacol. 2005;204:216–237. - PubMed
    1. Thiebaut F, Tsuruo T, Hamada H, Gottesman MM, Pastan I, et al. Cellular localization of the multidrug-resistance gene product P-glycoprotein in normal human tissues. Proc Natl Acad Sci U S A. 1987;84:7735–7738. - PMC - PubMed
    1. Cordon-Cardo C, O'Brien JP, Casals D, Rittman-Grauer L, Biedler JL, et al. Multidrug-resistance gene (P-glycoprotein) is expressed by endothelial cells at blood-brain barrier sites. Proc Natl Acad Sci U S A. 1989;86:695–698. - PMC - PubMed

Publication types

MeSH terms