. 2012;7(5):e36548.
doi: 10.1371/journal.pone.0036548. Epub 2012 May 1.

R-Smad competition controls activin receptor output in Drosophila

Affiliations

R-Smad competition controls activin receptor output in Drosophila

Aidan J Peterson et al. PLoS One. 2012.

Abstract

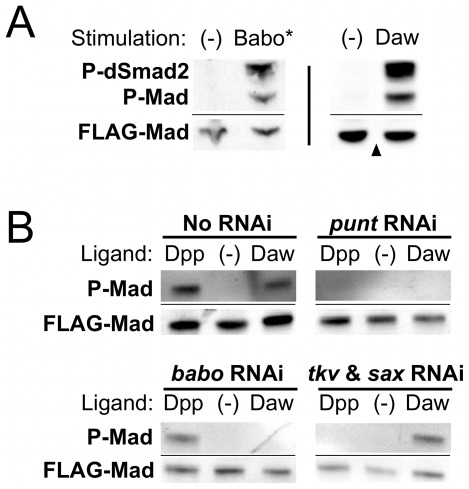
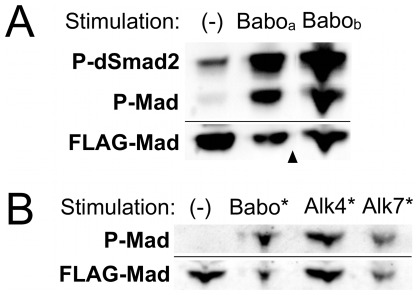
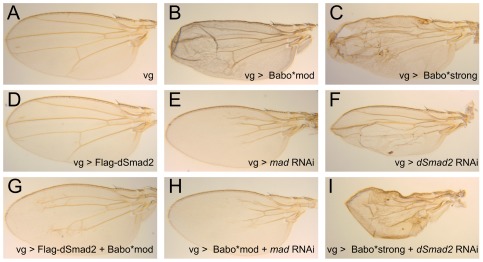
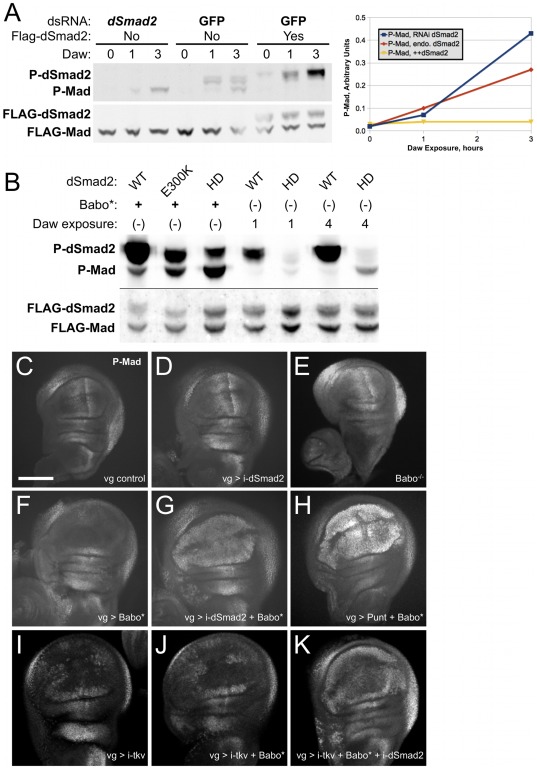
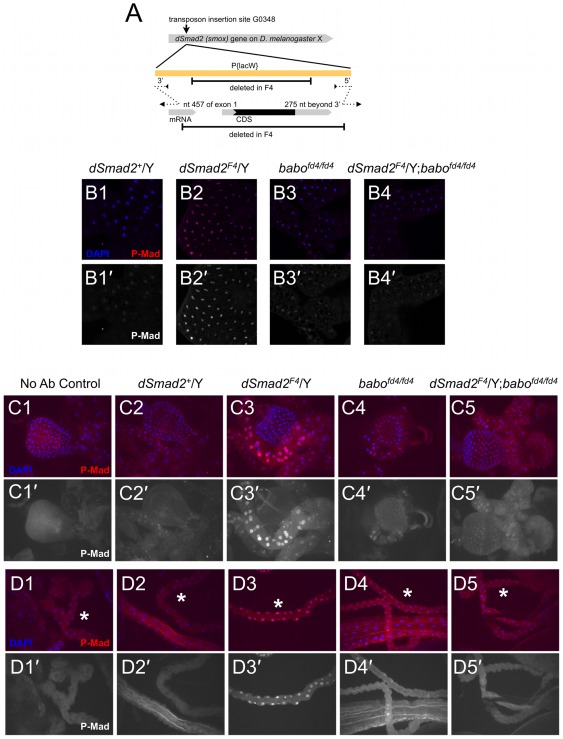
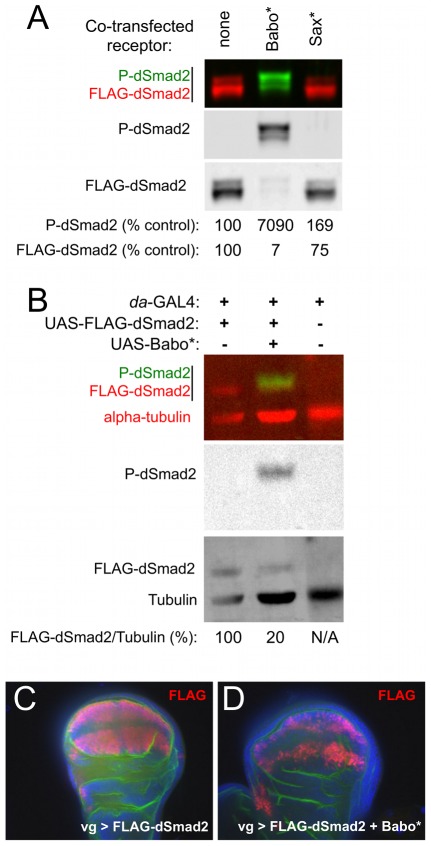
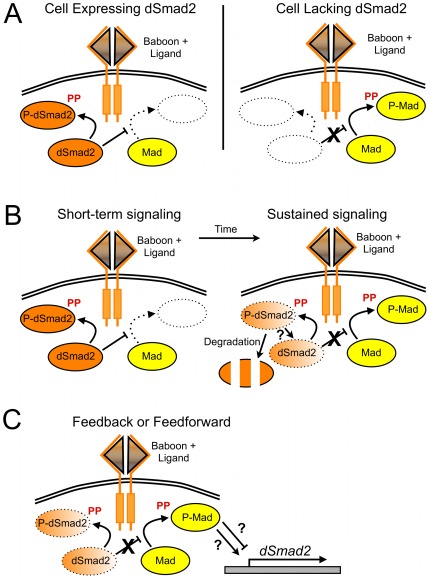
Animals use TGF-β superfamily signal transduction pathways during development and tissue maintenance. The superfamily has traditionally been divided into TGF-β/Activin and BMP branches based on relationships between ligands, receptors, and R-Smads. Several previous reports have shown that, in cell culture systems, "BMP-specific" Smads can be phosphorylated in response to TGF-β/Activin pathway activation. Using Drosophila cell culture as well as in vivo assays, we find that Baboon, the Drosophila TGF-β/Activin-specific Type I receptor, can phosphorylate Mad, the BMP-specific R-Smad, in addition to its normal substrate, dSmad2. The Baboon-Mad activation appears direct because it occurs in the absence of canonical BMP Type I receptors. Wing phenotypes generated by Baboon gain-of-function require Mad, and are partially suppressed by over-expression of dSmad2. In the larval wing disc, activated Baboon cell-autonomously causes C-terminal Mad phosphorylation, but only when endogenous dSmad2 protein is depleted. The Baboon-Mad relationship is thus controlled by dSmad2 levels. Elevated P-Mad is seen in several tissues of dSmad2 protein-null mutant larvae, and these levels are normalized in dSmad2; baboon double mutants, indicating that the cross-talk reaction and Smad competition occur with endogenous levels of signaling components in vivo. In addition, we find that high levels of Activin signaling cause substantial turnover in dSmad2 protein, providing a potential cross-pathway signal-switching mechanism. We propose that the dual activity of TGF-β/Activin receptors is an ancient feature, and we discuss several ways this activity can modulate TGF-β signaling output.


Conflict of interest statement

Competing Interests: The authors have declared that no competing interests exist.

Figures

Figure 1
Figure 1. Stimulation of the Baboon receptor leads to phosphorylation of both R-Smads independently of BMP Type I receptors.
S2 cells were transiently transfected with FLAG-tagged Smad expression constructs and analyzed by Western blot for C-terminal phosphorylation (P-dSmad2 and P-Mad). The FLAG-Mad band is shown as a loading control (FLAG-dSmad2 is not a useful loading control because of signaling-induced degradation as described later in the text). For all Western blot figures, a thin horizontal line indicates different infrared channels from the same blot. Co-expression of a constitutively active form of Baboon (Babo*) led to phosphorylation of dSmad2 and Mad (A, left blot). Exposure of cells expressing endogenous Baboon to the Dawdle ligand (Daw) had the same effect (A, right blot). RNAi treatment was used to determine receptor requirement for ligand activity (B). Controls confirmed that Dpp ligand treatment caused Mad phosphorylation independently of Baboon (B, left half). Dpp activity required the Punt Type II receptor and the Tkv and Sax BMP Type I receptors (B, right half). In contrast, Daw signaling to Mad required Baboon and Punt, but not Tkv and Sax.
Figure 2
Figure 2. All isoforms of Baboon and mammalian Activin receptors can initiate cross-talk.
(A) Overexpression of wildtype Baboa or Babob in S2 cells led to phosphorylation of dSmad2 and Mad. In this experiment there was a detectable background level of P-dSmad2 well below the Babo-induced levels. Arrowhead indicates that the displayed image contains two portions of one blot. (B) Constitutively active versions of mammalian Activin receptors Alk4 and Alk7 (Alk4* and Alk7*), like Babo*, induce phosphorylation of Drosophila Mad in S2 cells.
Figure 3
Figure 3. Excessive Baboon signaling perturbs wing development in a Mad-dependent manner.
vestigial-GAL4 (vg) was used to express combinations of Baboon, dSmad2, and RNAi for mad and dSmad2. Normal wing development (A; one copy of vg-GAL4) was disrupted by Babo* expression (B, C; Babo*mod and Babo*strong are UAS insertions with varying activity as characterized in other assays). The Babo* phenotype was abrogated by simultaneous mad RNAi (H) and resembled mad RNAi alone (E). In contrast, the crumpling defect of Babo* wings was enhanced in conjunction with dSmad2 RNAi (I) and was more severe than dSmad2 RNAi alone (F). Overexpression of FLAG-dSmad2 did not affect wing formation (D), but partially rescued the Babo* overexpression phenotype, producing normal sized flat wings with residual peripheral vein defects (G). For each genotype, a representative wing is shown out of 4–7 wings photographed. Within a genotype there was only slight variation in appearance, except that 3/6 dSmad2 RNAi wings had vein defects and a blister (shown) and 3/6 had vein defects without a blister (not shown).
Figure 4
Figure 4. Baboon phosphorylation of Mad is inhibited by dSmad2.
(A) Phospho-Smad accumulation upon exposure to Daw ligand. S2 cells transfected with Flag-Mad were treated with dsRNA for dSmad2 or GFP, and transfected with Flag-dSmad2 as indicated. Phospho-Smad and Flag signals were assayed on samples before Daw exposure and after 1 and 3 hours of incubation. Note that there is a gel artifact affecting the appearance of the Flag bands in several lanes. Quantified P-Mad band intensities are plotted to illustrate that accumulation of P-Mad depends on the level of dSmad2. The experiment was repeated with several batches of reporter cells, and the relative signals for the 3 hour time point were always observed in the same order. The 1 hour time points were near background detection and are less reliable due to noise. (B) Mutated dSmad2 proteins with varying phosphorylation efficiency modulate the rate of P-Mad accumulation. Babo* stimulation revealed the steady-state levels of P-dSmad2 and P-Mad. Daw exposure for 1 or 4 hours showed the difference in response to short-term signaling between the WT and HD forms of dSmad2. In both conditions, P-Mad levels were inversely correlated to P-dSmad2 levels. (C–K) Wing imaginal discs from third instar larvae were stained to detect P-Mad and imaged by confocal microscopy. For each condition at least three discs were imaged, and a representative Maximal Intensity Projection encompassing the wing blade is shown (6 sections @ 3 micron interval for C,D,F–H; all sections @ 3 micron interval for E; 5 sections @ 2 micron interval for I–K). Anterior is to the left and the scale bar shown in panel C applies to C–K. The normal P-Mad staining pattern is shown for vg-GAL4 alone (C; scale bar = 100 microns). Expression of a UAS-dSmad2 RNAi construct did not alter the P-Mad pattern or the shape of the wing disc (D). Wing discs from babofd4/fd4 homozygotes showed nearly normal pMad gradient (E). Expression of Babo* altered P-Mad staining, obliterating the normal gradient in the pouch (F). Note the normal P-Mad staining outside of the pouch where vg-Gal4 is not expressed. Babo* and dSmad2 RNAi together generated ectopic P-Mad in the entire wing pouch (G). Providing Babo* with additional Punt also produced ectopic P-Mad (H). tkv RNAi prevented P-Mad accumulation in the middle of the wing pouch (I), and addition of Babo* did not counteract this P-Mad pattern (J). Additional knockdown of dSmad2 led to ectopic P-Mad (K), which paralleled the results without tkv RNAi. Data in panels C, D, F, and G were from the same experiment and were stained in parallel. Panel H is from a different experiment, but the pouch signals can be compared to the others because the endogenous P-Mad along the posterior margin has similar staining. Samples in panels I–K were stained and processed in parallel.
Figure 5
Figure 5. P-Mad elevation in dSmad2 null mutant tissues depends on baboon.
The schematic depicts the location of the l(X)G0348 P element insertion in relation to the dSmad2 locus (A). The F4 excision product removed the entire coding region of dSmad2 and portions of the P-element. The genomic breakpoints are indicated above the dSmad2 mRNA; they were determined by sequencing PCR products, indicated by dotted lines. (B–D) P-Mad was detected by IHC of fixed larval tissues from several genotypes. For each image, a merged DAPI (blue) and P-Mad (red) panel is displayed above the isolated P-Mad channel. (B) Single confocal sections of P-Mad staining in the fat body. Under the staining conditions employed, endogenous nuclear P-Mad in a control fat body was barely detected (B1), but was increased in a dSmad2 null mutant animal (B2). Baboon single mutants and dSmad2; baboon double mutants had normal P-Mad staining (B3,4). (C, D) P-Mad staining at two representative positions along the digestive tract. Images are Maximal Intensity Projections of 3 micron interval confocal sections through the entire sample. The P-Mad primary antibody was omitted from “No Ab Control” samples to convey any background staining and auto-fluorescence in the red channel. (C) In the gastric caeca near the proventriculus, dSmad2 mutants showed elevated P-Mad (C3) compared to wildtype control males (C2). baboon single mutants and dSmad2; baboon double mutants showed wildtype levels (C4 and C5). Distal Malpighian tubule staining (lumpy tubes marked with asterisks) showed the same pattern, with the dSmad2 mutant displaying the strongest P-Mad staining (D3 compared to D2, D4 and D5).
Figure 6
Figure 6. Hyperactive Baboon signaling leads to dSmad2 destabilization.
The steady-state level of transfected dSmad2 in S2 cells was significantly reduced when Babo* was co-expressed (A). Quantified band intensities are displayed as a percentage of the control for each channel. Note that the P-dSmad2 level was greatly increased but the total dSmad2 level was reduced in the presence of Babo*, causing a greater than 1000-fold increase in the ratio of P-dSmad2 to total Flag-dSmad2. This effect was specific to Babo*, as inclusion of activated Saxophone (Sax*) neither stimulated P-dSmad2 nor significantly decreased the FLAG-dSmad2 signal (A, right lane). FLAG-dSmad2 was expressed in embryos using the da-GAL4 driver, either alone or with Babo* (B). Total exogenous dSmad2 and P-dSmad2 was detected by Western blot and the amount of FLAG-dSmad2 was normalized to endogenous alpha-tubulin. (C, D) vg-GAL4 was used to express Flag-dSmad2 alone (C) or with Babo* (D) in the wing disc. FLAG antibody IHC was used to gauge dSmad2 levels (red), and DAPI (blue) and aPKC IHC (green) are shown as counter-stains. Each image is a single confocal plane through the wing blade, and represents at least three discs stained per genotype.
Figure 7
Figure 7. Models of signaling outputs generated by dual kinase activity of the Baboon receptor.
Given the potential of Baboon to phosphorylate and activate dSmad2 and Mad, we present several configurations of Baboon, dSmad2 and Mad interaction that would generate different signaling outputs. In each schematic, only the most relevant pathway components are drawn. The first model represents a logic gate, where the ability of Baboon to phosphorylate Mad is strictly controlled by the expression of dSmad2 in that cell (A). Another model incorporates the observed degradation of dSmad2 in response to Baboon signaling (B). The final model (C) incorporates feed-back or feed-forward of Mad activity through dSmad2 regulation. If P-Mad positively regulated dSmad2 this would prevent the complete loss of dSmad2. Conversely, if P-Mad negatively regulated dSmad2 expression, this would enforce the switch from Baboon signaling through dSmad2 towards Mad.

References

    1. Shi Y, Massagué J. Mechanisms of TGF-β signaling from cell membrane to the nucleus. Cell. 2003;113:685–700. - PubMed
    1. Shimmi O, Umulis D, Othmer H, O'Connor MB. Facilitated transport of a Dpp/Scw heterodimer by Sog/Tsg leads to robust patterning of the Drosophila blastoderm embryo. Cell. 2005;120:873–886. - PMC - PubMed
    1. Sapkota G, Alarcón C, Spagnoli FM, Brivanlou AH, Massagué J. Balancing BMP signaling through integrated inputs into the Smad1 linker. Mol Cell. 2007;25:441–454. - PubMed
    1. Zhang YE. Non-Smad pathways in TGF-β signaling. Cell Res. 2009;19:128–139. - PMC - PubMed
    1. Huminiecki L, Goldovsky L, Freilich S, Moustakas A, Ouzounis C, et al. Emergence, development and diversification of the TGF-β signalling pathway within the animal kingdom. BMC Evol Biol. 2009;9:28. - PMC - PubMed

Publication types

MeSH terms