

Universal features of correlated bursty behaviour
- PMID: 22563526
- PMCID: PMC3343322
- DOI: 10.1038/srep00397
Universal features of correlated bursty behaviour
Abstract
Inhomogeneous temporal processes, like those appearing in human communications, neuron spike trains, and seismic signals, consist of high-activity bursty intervals alternating with long low-activity periods. In recent studies such bursty behavior has been characterized by a fat-tailed inter-event time distribution, while temporal correlations were measured by the autocorrelation function. However, these characteristic functions are not capable to fully characterize temporally correlated heterogenous behavior. Here we show that the distribution of the number of events in a bursty period serves as a good indicator of the dependencies, leading to the universal observation of power-law distribution for a broad class of phenomena. We find that the correlations in these quite different systems can be commonly interpreted by memory effects and described by a simple phenomenological model, which displays temporal behavior qualitatively similar to that in real systems.
Figures
 ,
,  and
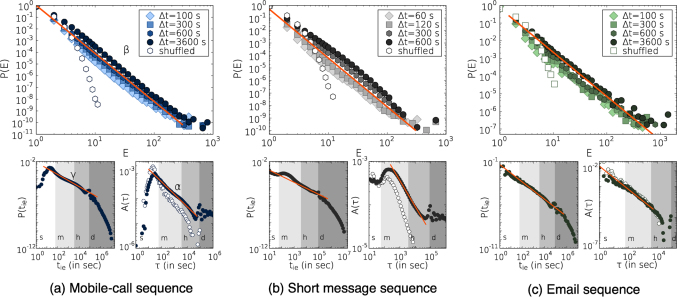
and  (b) Almost the same exponents were estimated for short message sequences taking values
  ,
,  and
and  . (c) Email event sequence with estimated exponents
  ,
,  and
and  . A gap in the tail of A(τ) on figure (c) appears due to logarithmic binning and slightly negative correlation values. Empty symbols assign the corresponding calculation results on independent sequences. Lanes labeled with s, m, h and d are denoting seconds, minutes, hours and days respectively.
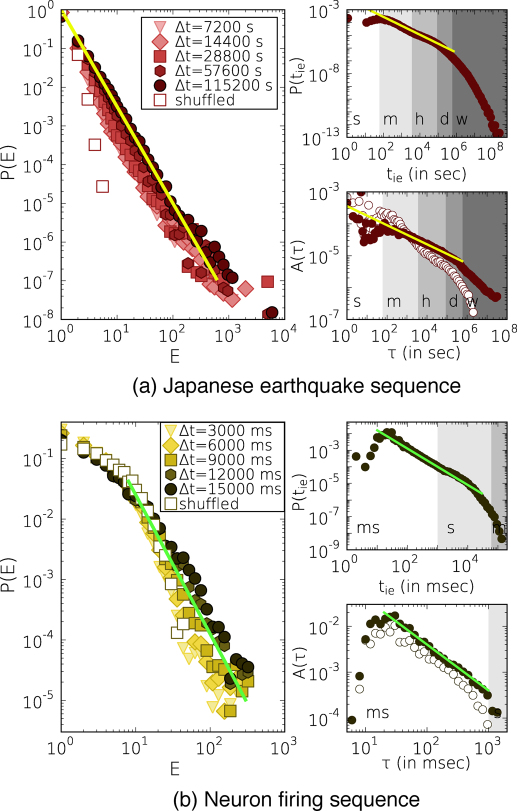
 ,
,  and
and  . Inter-event times for P(tie) were counted with 10 second resolution. (b) Firing sequences of single neurons with 2 millisecond resolution. The corresponding exponents take values as
  ,
,  and
and  . Empty symbols assign the calculation results on independent sequences. Lanes labeled with ms, s, m, h, d and w are denoting milliseconds, seconds, minutes, hours, days and weeks respectively.
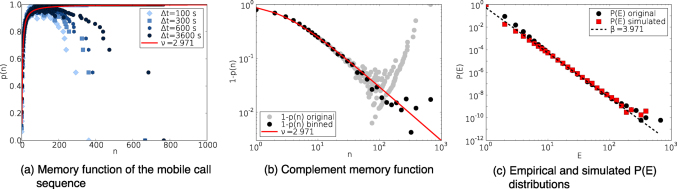
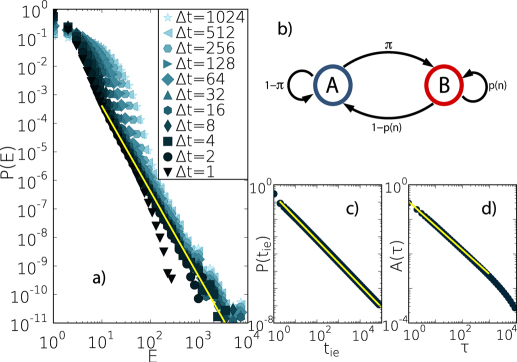
 . The corresponding exponent value is γ = 1.3. (d) The average logarithmic binned autocorrelation function with a maximum lag τmax = 104. The function can be characterized by an exponent α = 0.7. Simulation results averaged over 1000 independent realizations with parameters µA = 0.3, µB = 5.0, ν = 2.0, π = 0.1 and T = 109. For the calculation we chose the maximum inter-event time
  , which is large enough not to influence short temporal behavior, but it increases the program performance considerably.
References
-
- Corral Á. Long-Term Clustering, Scaling, and Universality in the Temporal Occurrence of Earthquakes. Phys. Rev. Lett. 92, 108501 (2004). - PubMed
-
- Wheatland M. S. & Sturrock P. A. The Waiting-Time Distribution of Solar Flare Hard X-ray Bursts. Astrophys. J. 509, 448 (1998). - PubMed
-
- Kemuriyama T. et al. A power-law distribution of inter-spike intervals in renal sympathetic nerve activity in salt-sensitive hypertension-induced chronic heart failure. BioSystems 101, 144–147 (2010). - PubMed
-
- Barabási A.-L. The origin of bursts and heavy tails in human dynamics. Nature 435, 207–211 (2005). - PubMed
-
- Oliveira J. G. & Barabási A.-L. Human dynamics: Darwin and Einstein correspondence patterns. Nature 437 1251 (2005). - PubMed
LinkOut - more resources
Full Text Sources
Other Literature Sources
