Simple model of hydrophobic hydration
- PMID: 22564051
- PMCID: PMC5234790
- DOI: 10.1021/jp300743a
Simple model of hydrophobic hydration
Abstract
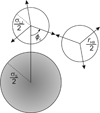
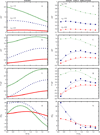
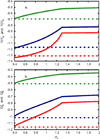
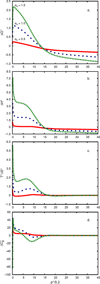
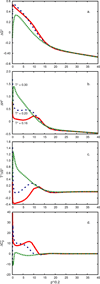
Water is an unusual liquid in its solvation properties. Here, we model the process of transferring a nonpolar solute into water. Our goal was to capture the physical balance between water's hydrogen bonding and van der Waals interactions in a model that is simple enough to be nearly analytical and not heavily computational. We develop a 2-dimensional Mercedes-Benz-like model of water with which we compute the free energy, enthalpy, entropy, and the heat capacity of transfer as a function of temperature, pressure, and solute size. As validation, we find that this model gives the same trends as Monte Carlo simulations of the underlying 2D model and gives qualitative agreement with experiments. The advantages of this model are that it gives simple insights and that computational time is negligible. It may provide a useful starting point for developing more efficient and more realistic 3D models of aqueous solvation.
Figures




Similar articles
-
Water's hydrogen bonds in the hydrophobic effect: a simple model.J Phys Chem B. 2005 Dec 15;109(49):23611-7. doi: 10.1021/jp0526750. J Phys Chem B. 2005. PMID: 16375338
-
The application of the thermodynamic perturbation theory to study the hydrophobic hydration.J Chem Phys. 2013 Jul 14;139(2):024101. doi: 10.1063/1.4812744. J Chem Phys. 2013. PMID: 23862923 Free PMC article.
-
A statistical mechanical theory for a two-dimensional model of water.J Chem Phys. 2010 Jun 14;132(22):224507. doi: 10.1063/1.3454193. J Chem Phys. 2010. PMID: 20550408 Free PMC article.
-
Modeling water, the hydrophobic effect, and ion solvation.Annu Rev Biophys Biomol Struct. 2005;34:173-99. doi: 10.1146/annurev.biophys.34.040204.144517. Annu Rev Biophys Biomol Struct. 2005. PMID: 15869376 Review.
-
Unraveling water's entropic mysteries: a unified view of nonpolar, polar, and ionic hydration.Acc Chem Res. 2008 Aug;41(8):957-67. doi: 10.1021/ar7001478. Acc Chem Res. 2008. PMID: 18710198 Review.
Cited by
-
On the Dependence of Prion and Amyloid Structure on the Folding Environment.Int J Mol Sci. 2021 Dec 16;22(24):13494. doi: 10.3390/ijms222413494. Int J Mol Sci. 2021. PMID: 34948291 Free PMC article.
-
The expanded genetic alphabet.Angew Chem Int Ed Engl. 2015 Oct 5;54(41):11930-44. doi: 10.1002/anie.201502890. Epub 2015 Aug 25. Angew Chem Int Ed Engl. 2015. PMID: 26304162 Free PMC article. Review.
-
How Water's Properties Are Encoded in Its Molecular Structure and Energies.Chem Rev. 2017 Oct 11;117(19):12385-12414. doi: 10.1021/acs.chemrev.7b00259. Epub 2017 Sep 26. Chem Rev. 2017. PMID: 28949513 Free PMC article.
-
Core-softened fluids as a model for water and the hydrophobic effect.J Chem Phys. 2013 Sep 21;139(11):114504. doi: 10.1063/1.4821226. J Chem Phys. 2013. PMID: 24070294 Free PMC article.
-
Analytical model for three-dimensional Mercedes-Benz water molecules.Phys Rev E Stat Nonlin Soft Matter Phys. 2012 Jun;85(6 Pt 1):061503. doi: 10.1103/PhysRevE.85.061503. Epub 2012 Jun 25. Phys Rev E Stat Nonlin Soft Matter Phys. 2012. PMID: 23005100 Free PMC article.
References
-
- Pratt LR, Pohorille A. Chem. Rev. 2002;102:2671–2692. - PubMed
-
- Widom B, Bhimalapuram P, Koga K. Phys. Chem. Chem. Phys. 2003;5:3085–3093.
-
- Pratt LR, Chandler D. J. Chem. Phys. 1977;67:3683–3704.
-
- Ben-Naim A. Hydrophobic Interactions. New York: Plemun; 1980.
Publication types
MeSH terms
Substances
Grants and funding
LinkOut - more resources
Full Text Sources
Research Materials

