. 2012 Nov;16(11):2667-78.
doi: 10.1111/j.1582-4934.2012.01584.x.

Epigallocatechin-3-gallate induces mesothelioma cell death via H2 O2 -dependent T-type Ca2+ channel opening

Affiliations

Epigallocatechin-3-gallate induces mesothelioma cell death via H2 O2 -dependent T-type Ca2+ channel opening

Elia Ranzato et al. J Cell Mol Med. 2012 Nov.

Abstract

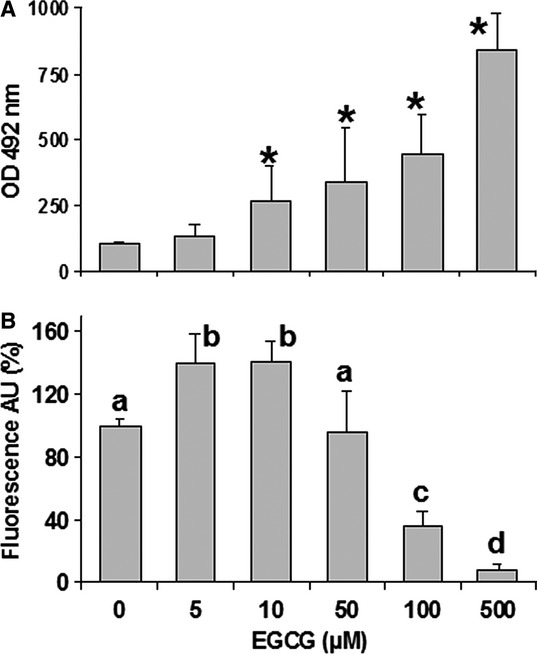
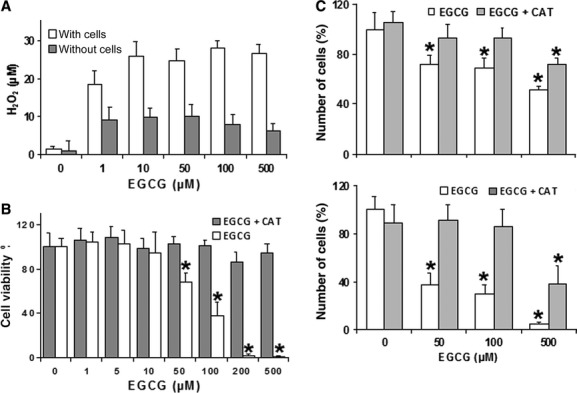
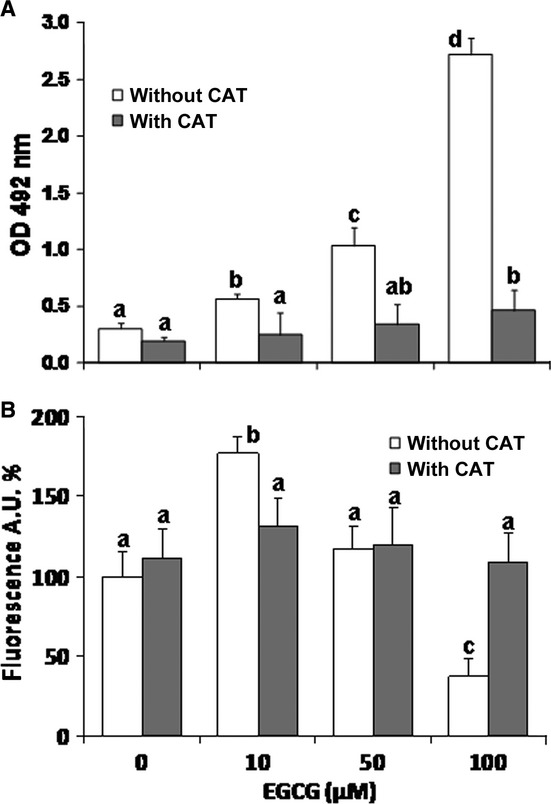
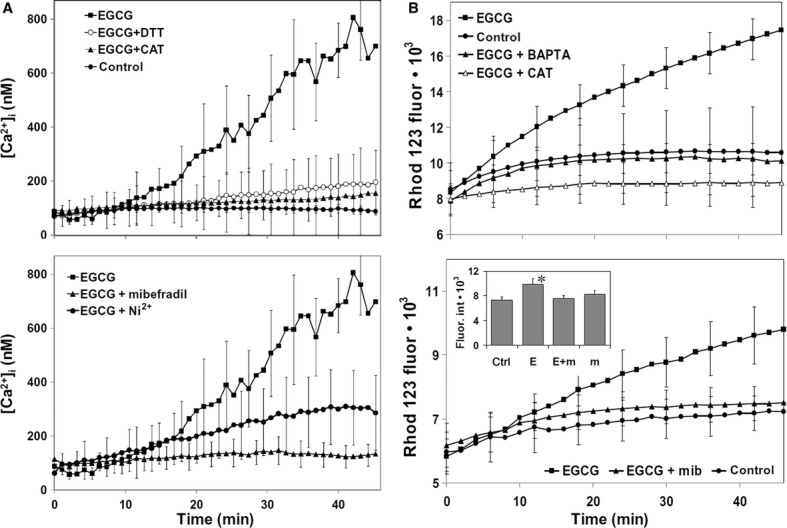
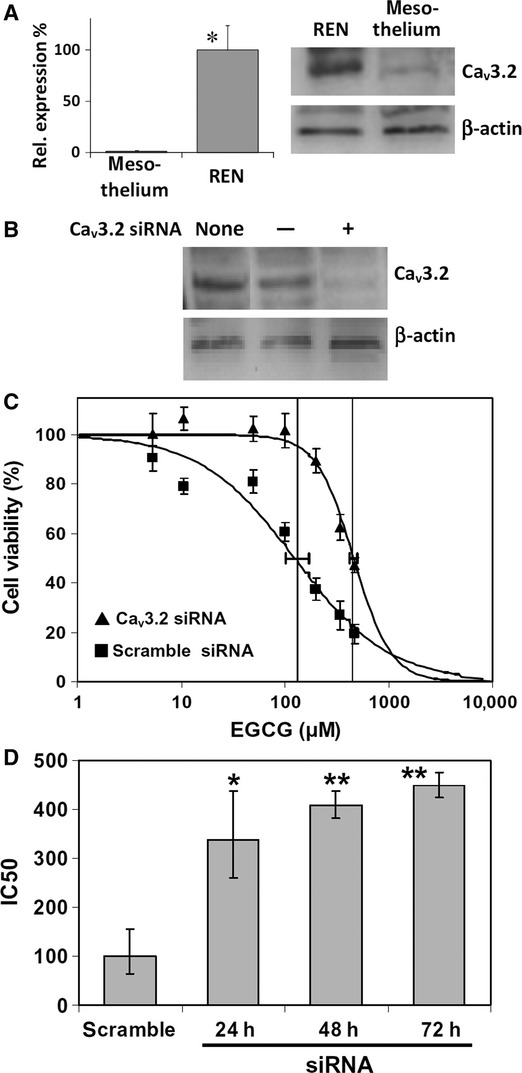
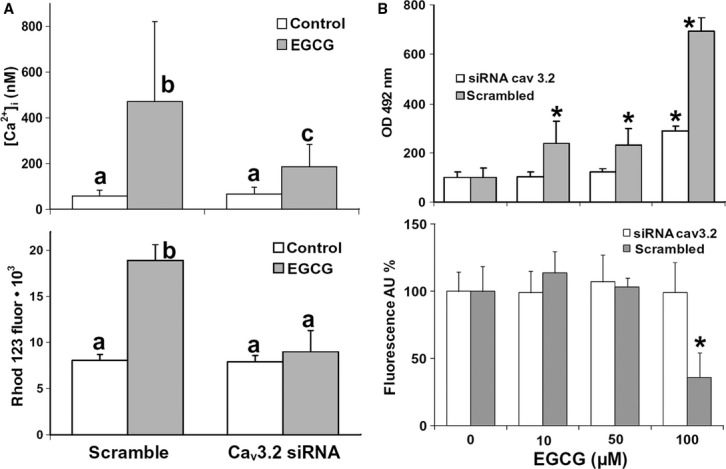
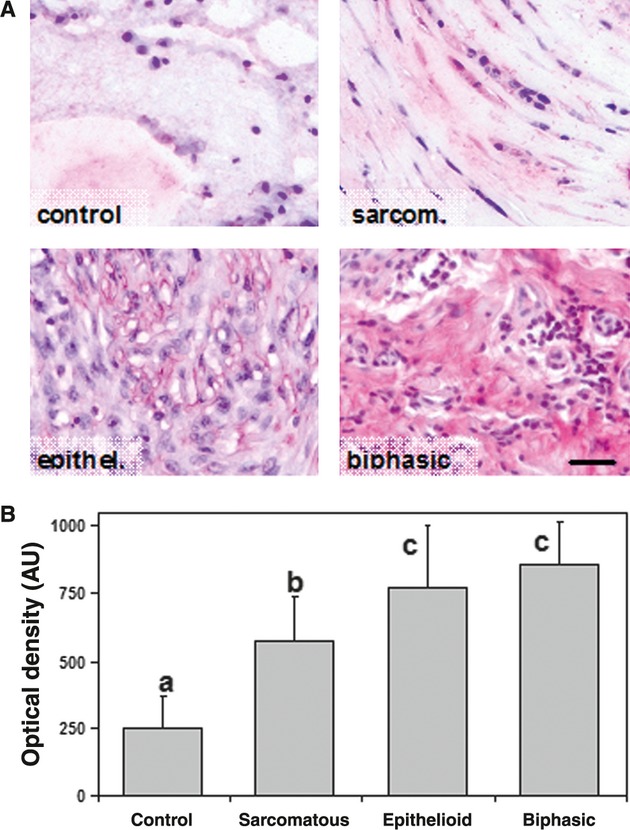
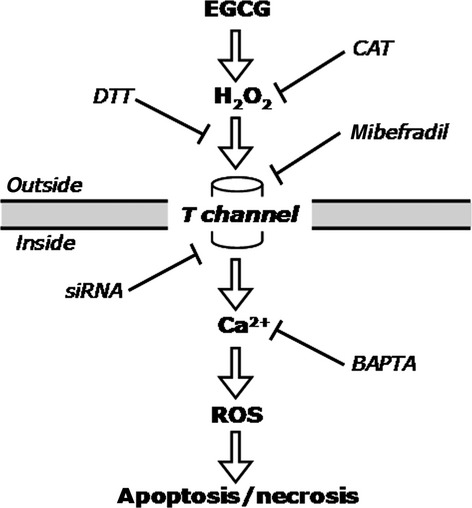
Malignant mesothelioma (MMe) is a highly aggressive, lethal tumour requiring the development of more effective therapies. The green tea polyphenol epigallocathechin-3-gallate (EGCG) inhibits the growth of many types of cancer cells. We found that EGCG is selectively cytotoxic to MMe cells with respect to normal mesothelial cells. MMe cell viability was inhibited by predominant induction of apoptosis at lower doses and necrosis at higher doses. EGCG elicited H(2) O(2) release in cell cultures, and exogenous catalase (CAT) abrogated EGCG-induced cytotoxicity, apoptosis and necrosis. Confocal imaging of fluo 3-loaded, EGCG-exposed MMe cells showed significant [Ca(2+) ](i) rise, prevented by CAT, dithiothreitol or the T-type Ca(2+) channel blockers mibefradil and NiCl(2) . Cell loading with dihydrorhodamine 123 revealed EGCG-induced ROS production, prevented by CAT, mibefradil or the Ca(2+) chelator BAPTA-AM. Direct exposure of cells to H(2) O(2) produced similar effects on Ca(2+) and ROS, and these effects were prevented by the same inhibitors. Sensitivity of REN cells to EGCG was correlated with higher expression of Ca(v) 3.2 T-type Ca(2+) channels in these cells, compared to normal mesothelium. Also, Ca(v) 3.2 siRNA on MMe cells reduced in vitro EGCG cytotoxicity and abated apoptosis and necrosis. Intriguingly, Ca(v) 3.2 expression was observed in malignant pleural mesothelioma biopsies from patients, but not in normal pleura. In conclusion, data showed the expression of T-type Ca(2+) channels in MMe tissue and their role in EGCG selective cytotoxicity to MMe cells, suggesting the possible use of these channels as a novel MMe pharmacological target.


Figures

Fig. 1
Fig. 1
(A) Lactate dehydrogenase (LDH) release in the supernatant of REN cells after exposure to increasing EGCG concentrations for 6 hrs. Data are means ± SD derived from 5 to 9 independent treatments, and expressed as optical densities at 492 nm (see Materials and methods). *P < 0.01 with respect to control according to the Dunnett's test. (B) Caspase 3 activity measured in REN cells exposed to EGCG as above. Data are means ± SD derived from 10 independent treatments, and expressed as fluorescence arbitrary units (see Materials and methods). Different letters on bars indicate significant differences according to the Tukey's test (P < 0.01).
Fig. 2
Fig. 2
(A) Production of H2O2 in DMEM medium after 1 hr incubation with increasing EGCG concentrations, in the presence or absence of REN cells. Data are means ± SD (n = 3) of H2O2 concentrations determined as described in the Materials and methods. All groups are significantly different with respect to their control (P < 0.01, Dunnett's test). (B) Determination of REN cell viability in response to increasing EGCG, in the presence or absence of exogenous CAT (500 units/ml). Data are extrapolated from the calcein-AM viability index after exposure of cells to EGCG for 24 hrs, and are expressed as means ± SD of two independent experiments, each with eight replicates. *P < 0.01 with respect to control according to the Dunnett's test. (C) Viable cell counts performed through microplate fluorometric DNA assays on REN cells, showing dose-response relations to increasing EGCG concentrations in the presence or absence of 500 units/ml CAT. The fluorescent signal was read after incubation with Hoechst 33258 (see Materials and methods). Data are expressed as means ± SD (n = 8 independent samples) of the estimated numbers of cells. The mean of control without CAT has been set to 100%. *P < 0.01 with respect to control according to the Dunnett's test.
Fig. 3
Fig. 3
(A) Lactate dehydrogenase (LDH) release in the supernatant of REN cells after 24 hrs exposures to different EGCG concentrations in the presence or absence of CAT (500 units/ml). Data are means ± SD (n = 6 independent replicates) expressed as absorbances at 492 nm (see Materials and methods). (B) Caspase 3 activity measured in REN cells exposed for 6 hrs to EGCG in the presence or absence of 500 units/ml CAT. Data are means ± SD derived from 3 to 5 (without CAT) or 8 to 11 (with CAT) independent treatments, and expressed as fluorescence arbitrary units (see Materials and methods). For each series, different letters on bars indicate significant differences according to the Tukey's test (P < 0.01).
Fig. 4
Fig. 4
(A) Intracellular Ca2+ variations recorded each minute for a period of 45 min. in individual REN cells, by using confocal imaging (see Materials and methods). Upper panel. Exposure to 100 μM EGCG induces a sustained rise in [Ca2+]i that is indicative of Ca2+ homeostasis disruption. External additions of DTT (2.5 mM) or CAT (500 units/ml) abolish the effect of EGCG (P < 0.001, Tukey's test carried out on 45-min. data). Lower panel. Pre-incubation with the Ca2+ channel blockers mibefradil (5 μM) or Ni2+ (30 μM NiCl2) significantly prevent the [Ca2+]i rise induced by 100 μM EGCG (P < 0.001, as above). Data are means ± SD of [Ca2+]i values recorded in different cells from three different experiments. Number of cells: 32 (control), 37 (EGCG), 33 (EGCG + DTT), 40 (EGCG + CAT), 26 (EGCG + mibefradil), 40 (EGCG + NiCl2). (B) ROS production in DHR 123-loaded REN cells growing in 96-well plates, recorded each 2 min. for a period of 46 min. in a fluorescence plate reader (see Materials and methods). Upper panel: Exposure to 100 μM EGCG induces an increase in ROS production that is abolished by cell loading with the membrane-permeant Ca2+ chelator BAPTA-AM, or by external addition of 500 units/ml CAT (P < 0.001, as above). Lower panel: Pre-incubation with the Ca2+ channel blocker mibefradil (5 μM) prevents the rise in ROS production induced by 100 μM EGCG (P < 0.001, as above). Inset: Fluorescence values recorded at 45 min. in control cells (ctrl), or in cells incubated with EGCG alone (e), EGCG/mibefradil (E + m) and mibefradil alone (m) (*P < 0.001, Tukey's test). Data are means ± SD of rhodamine 123 fluorescence expressed in arbitrary units; n = 16 microplate wells from two different experiments.
Fig. 5
Fig. 5
(A) Expression of the Cav3.2 calcium channel gene and Cav3.2 protein in REN and mesothelial cells. Left panel: the mRNA quantity of Cav3.2 was determined by qRT-PCR (see Materials and methods) and is represented as mean relative expression ± SD (n = 3, *P < 0.001, t-test). Right panel: Western immunoblot analysis of cell lysates showing quite detectable expression of Cav3.2 peptide in REN cells and barely detectable expression in mesothelium. (B) Western immunoblot analysis of REN cell lysates showing Cav3.2 down-regulation by RNA interference (siRNA). REN cells were transfected or not (none) with 5 μM negative control siRNA (−), or specific Cav3.2 siRNA (+), with a 24-hr interval. (C) Dose-response curves derived from the NRU endpoint, showing a significant reduction of EGCG cytotoxicity to REN cells after 72 hrs Cav3.2 siRNA, with respect to scramble siRNA, as shown by rightward IC50 shift (P < 0.05). Data are means ± SD percent cell viabilities obtained from eight replicates. Downhill logistic regression lines, IC50 values (vertical lines) and 95% CI (horizontal bars) are shown. (D) Variation of EGCG IC50 on REN cells, after 24, 48 or 72 hrs Cav3.2 siRNA, or 24 hrs scramble siRNA. Data are means IC50 obtained from three independent experiments ±95% CI. *P < 0.05, **P < 0.01, with respect to scramble siRNA, according to the Dunnett's test.
Fig. 6
Fig. 6
(A) Upper panel: Measurements of [Ca2+]i by confocal imaging in fluo 3-loaded REN cells exposed or not to 100 μM EGCG for 45 min. In scramble siRNA-treated cells, EGCG induces a [Ca2+]i rise similar to the one observed in unmanipulated cells, whereas Cav3.2 siRNA significantly reduces such an effect. Data are means ± SD of [Ca2+]i values recorded in single cells from two different experiments. Number of cells: 26 (control/scramble siRNA), 31 (EGCG/scramble siRNA), 28 (control/Cav3.2 siRNA), 63 (EGCG/Cav3.2 siRNA). Lower panel: ROS production in DHR 123-loaded REN cells growing in 96-well plates, evaluated by rhodamine 123 after 45-min incubations with or without 100 μM EGCG. Pre-treatment with Cav3.2 siRNA for 24 hrs abolishes the ROS increase induced by EGCG, whereas scramble siRNA does not prevent it. The results are representative of two independent experiments. Data are mean fuorescence values ± SD, n = 20. Different letters on bars indicate significant differences according to the Tukey's test (P < 0.01). (B) Upper panel: LDH release in the supernatant of REN cells pretreated with Cav3.2 siRNA, or with scramble siRNA, and then exposed to increasing EGCG concentrations for 6 hrs. Data are means ± SD derived from 6 to 8 independent treatments, and expressed as optical densities at 492 nm (see Materials and methods). Lower panel: Caspase 3 activity measured in REN cells pretreated with siRNA and exposed to EGCG as above. Data are means ± SD derived from 10 to 20 independent treatments, and expressed as fluorescence arbitrary units (see Materials and methods). *P < 0.01 with respect to control according to the Dunnett's test.
Fig. 7
Fig. 7
(A) Immunohistochemical staining of Cav3.2 in normal pleura and in three types of MMe tissue (sarcomatous, epithelioid and biphasic). Immunoreactivity is scarcely detected in normal pleura, but it is clearly and differentially expressed (bright pink) in tumours. Bar = 30 μm. (B) Quantification of Cav3.2 immunoreaction obtained by digital imaging of stained slides (see Materials and methods). Data are expressed as means ± SD of optical densities (n = 75–155 different microscope fields). *P < 0.01.
Fig. 8
Fig. 8
Diagram depicting the mechanism of action of EGCG on MMe cells, as characterized in this study (see text for further explanation).

References

    1. Pass HI, Vogelzang N, Hahn S, et al. Malignant pleural mesothelioma. Curr Probl Cancer. 2004;28:93–174. - PubMed
    1. Belli C, Fennell D, Giovannini M, et al. Malignant pleural mesothelioma: current treatments and emerging drugs. Expert Opin Emerg Drugs. 2009;14:423–37. - PubMed
    1. Sueoka E, Sueoka N, Okabe S, et al. Expression of the tumour necrosis factor alpha gene and early response genes by nodularin, a liver tumour promoter, in primary cultured rat hepatocytes. J Cancer Res Clin Oncol. 1997;123:413–9. - PubMed
    1. Tomek S, Emri S, Krejcy K, Manegold C. Chemotherapy for malignant pleural mesothelioma: past results and recent developments. Br J Cancer. 2003;88:167–74. - PMC - PubMed
    1. Fennell DA, Gaudino G, O'Byrne KJ, et al. Advances in the systemic therapy of malignant pleural mesothelioma. Nat Clin Pract Oncol. 2008;5:136–47. - PubMed

Publication types

MeSH terms