Review
. 2012 Jul;52(1):93-102.
doi: 10.1016/j.ceca.2012.04.009. Epub 2012 May 6.

Calcium-dependent physiologic and pathologic stimulus-metabolic response coupling in hepatocytes

Affiliations
Review

Calcium-dependent physiologic and pathologic stimulus-metabolic response coupling in hepatocytes

Lawrence D Gaspers et al. Cell Calcium. 2012 Jul.

Abstract

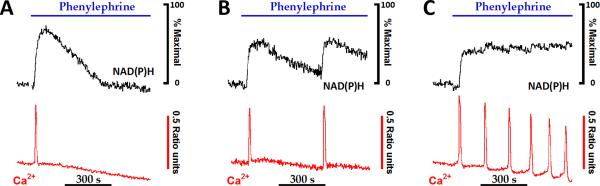
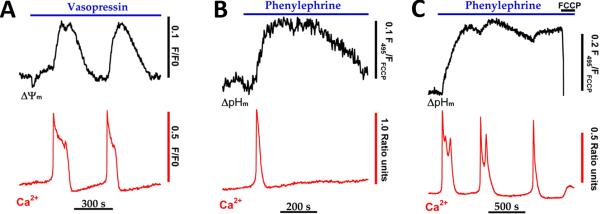
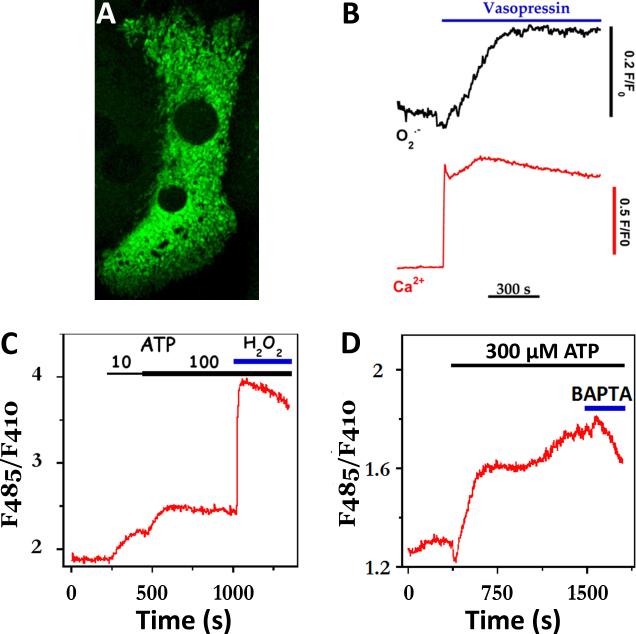
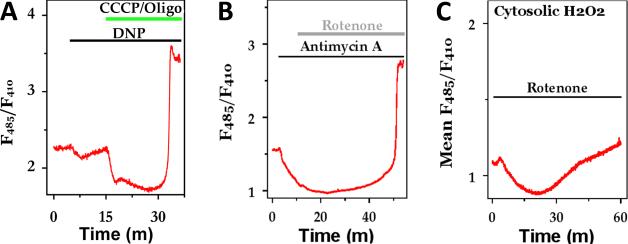
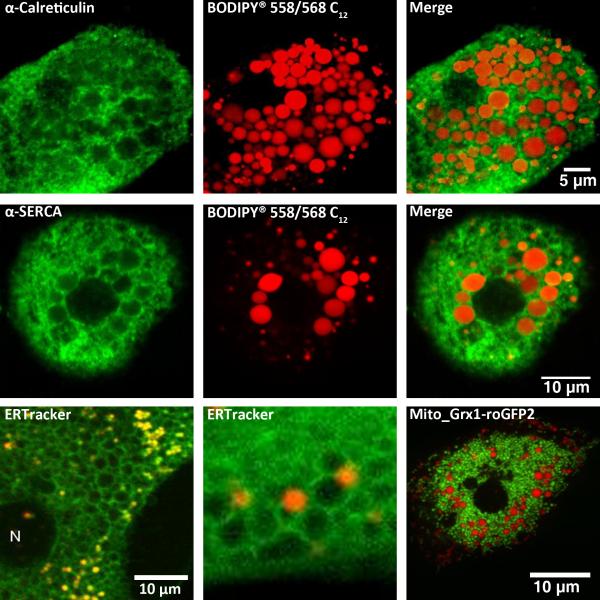
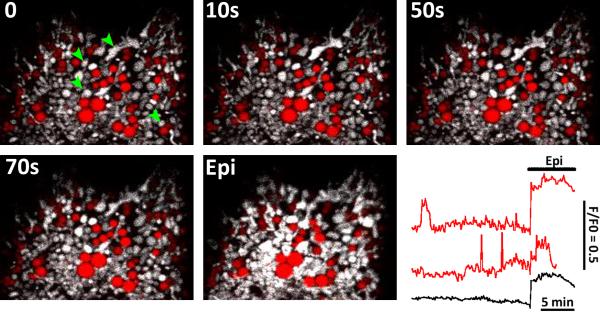
A recurrent paradigm in calcium signaling is the coordination of the target response of the calcium signal with activation of metabolic energy production to support that response. This occurs in many tissues, including cardiac and skeletal muscle where contractile activity and ATP production are coordinately regulated by the frequency and amplitude of calcium transients, endocrine and exocrine cells that use calcium to drive the secretory process, and hepatocytes where the downstream targets of calcium include both catabolic and anabolic processes. The primary mechanism by which calcium enhances the capacity for energy production is through calcium-dependent stimulation of mitochondrial oxidative metabolism, achieved by increasing NADH production and respiratory chain flux. Although this enhances energy supply, it also has the potential for deleterious consequences resulting from increased generation of reactive oxygen species (ROS). The negative consequences of calcium-dependent mitochondrial activation can be ameliorated when the underlying cytosolic calcium signals occur as brief calcium spikes or oscillations, with signal strength encoded through the spike frequency (frequency modulation). Frequency modulation increases signal fidelity, and reduces pathological effects of calcium, including excess mitochondrial ROS production and apoptotic or necrotic outcomes. The present article reviews these issues using data obtained in hepatocytes under physiologic and pathologic conditions.


Figures

Fig. 1
Fig. 1. Pyridine nucleotide fluorescence in hepatocytes
Confocal images depict NAD(P)H fluorescence in cultured hepatocytes (A) compared to hepatocytes in the intact perfused liver (B). Pyridine nucleotide fluorescence was detected with 720 nm multiphoton excitation as described in [38]. Images reproduced with permission [38].
Fig. 2
Fig. 2. The regulation of mitochondrial NAD(P)H production by increases in cytosolic calcium
Hepatocytes isolated from chow-fed rats were loaded with low levels of fura2/AM, as described previously [17, 18, 38], then stimulated with submaximal levels of phenylephrine, an α- adrenergic agonist. Agonist-evoked increases in fura-2 and NAD(P)H fluorescence intensities were monitored simultaneously [38]. NAD(P)H responses were normalized to the peak 360 nm fluorescence intensity changes obtained in the presence of rotenone plus ß-hydroxybutyrate (not shown). Data reproduced from [24] with permission.
Fig. 3
Fig. 3. Cytosolic calcium spikes stimulate a rise in mitochondrial proton motive force
Hepatocytes isolated from chow-fed rats were loaded with fura2/AM and TMREE (A) or fluorescein diacetate (B-C) then treated with submaximal hormone concentrations. Hormone-evoked increases in Ca2+ and mitochondrial membrane potential (ΔΨm) or Ca2+ and mitochondrial pH gradients (ΔpHm) were monitored simultaneously as described [17, 38]. The protonophore, FCCP (5 μM), was added in C to completely collapse mitochondrial PMF. The data in panel A are reproduced from [38] with permission.
Fig. 4
Fig. 4. Hormone-evoked increases in the rate of mitochondrial ROS formation
(A) Maximal intensity projection of two adjacent hepatocytes expressing mitochondrial-targeted cpYFP, a superoxide-sensitive fluorescent protein. (B) Simultaneous measurement of cytosolic Ca2+ and mitochondrial superoxide (O2•-) increases evoked by maximal vasopressin concentrations (100 nM). Increases in Ca2+ were monitored with fura-2, while 485nm excitation of cpYFP was used to follow O2•- responses. Note: fura-2 overlaps with the 410nm portion of the cpYFP spectrum. (C-D) High levels of extracellular ATP evoke sustained increases in the production of mitochondrial H2O2. Production of H2O2 was monitored with mitochondrial targeted Hyper™ and alternating excitation at 485nm and 410nm. Exogenous H2O2 (100 μM) was added at the end of the run to maximally oxidize the biosensor (C). In panel D, excess BAPTA free acid (2 mM, blue bar) was added to chelate extracellular Ca2+.
Fig 5
Fig 5. Reactive oxygen species formation in hepatocytes
(A-B) The effect of mitochondrial uncouplers and respiratory inhibitors on mitochondrial H2O2 production. (C) The effect of inhibiting mitochondrial respiration on cytosolic H2O2 production. Additions are dinitrophenol (DNP; 20μM), CCCP plus oligomycin (5 μM/ 1μg/ml), 1 μM antimycin A and 1 μM rotenone.
Fig 6
Fig 6. Lipid droplets
Hepatocytes isolated from alcohol-fed rats (top row) or their pair-fed littermate controls (middle row) were maintained in primary culture for 4 hrs. Lipid droplets were labeled for 2-4 hrs with the red fluorescent fatty acid analogue Bodipy® 558/568 C12 (red pseudocolor). Cells from pair-fed controls (middle row) were also incubated with 300 μM oleic acid to induce lipid droplet formation. Cultures were fixed with 1% paraformaldehyde and then immunoreactivity for calreticulin or SERCA (kind gift from Dr. J. Lytton) was determined. Top row: calreticulin immunoreactivity in an alcoholic hepatocyte. Middle row: SERCA immunoreactivity in a lipid-loaded control hepatocyte. Bottom row: Live hepatocytes from chow-fed rats were stained with 200 nM ER tracker (green pseudocolor) and Bodipy® 558/568 C12 (red pseudocolor), or transfected with a mitochondrial targeted glutathione biosensor Grx1-roGFP2 (kind gift from Dr. T. Dick, green pseudocolor) then incubated with the fatty acid analogue (bottom right most panel).
Fig 7
Fig 7. Spontaneous mitochondrial Ca2+ spikes and lipid droplets
Hepatocytes isolated from chow-fed rats were transfected with mitochondrial-targeted GcamP3 (provided by Dr. L. Looger via Addgene) then incubated overnight with Bodipy® 558/568 C12 and oleic acid. Confocal images depict GcamP3 fluorescence intensity in gray scale and Bodipy® 558/568 C12 in red. Green arrowheads point to mitochondria that display spontaneous mitochondrial Ca2+ increases. The red traces show mitochondrial Ca2+ responses in single mitochondrion or mitochondrial clusters. The black trace is the whole cell calcium response. At the end of the run, the culture was treated with 1 μM epinephrine (Epi) to elicit a global cytosolic/mitochondrial calcium increase.

References

    1. Berridge MJ. Inositol trisphosphate and calcium signalling. Nature. 1993;361:315–325. - PubMed
    1. Clapham DE. Calcium signaling. Cell. 1995;80:259–268. - PubMed
    1. Rhee SG. Regulation of phosphoinositide-specific phospholipase C. Annu Rev Biochem. 2001;70:281–312. - PMC - PubMed
    1. Gaspers LD, Thomas AP. Calcium signaling in liver. Cell Calcium. 2005;38:329–342. - PubMed
    1. Gaspers LD, Pierobon N, Thomas AP. Calcium signaling. In: Dufour JF, Clavien P-A, editors. Signaling Pathways in Liver Disease. Springer-Verlag GmbH & Co. KG; Heidelberg, Germany: 2005. pp. 211–221.

Publication types