. 2012 Aug;125(4):759-71.
doi: 10.1007/s00122-012-1868-9. Epub 2012 May 8.

Genome-enabled prediction of genetic values using radial basis function neural networks

Affiliations

Genome-enabled prediction of genetic values using radial basis function neural networks

J M González-Camacho et al. Theor Appl Genet. 2012 Aug.

Abstract

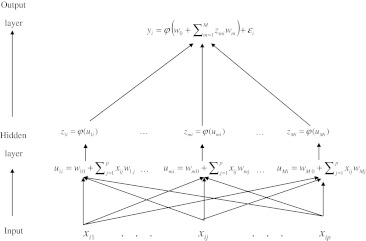
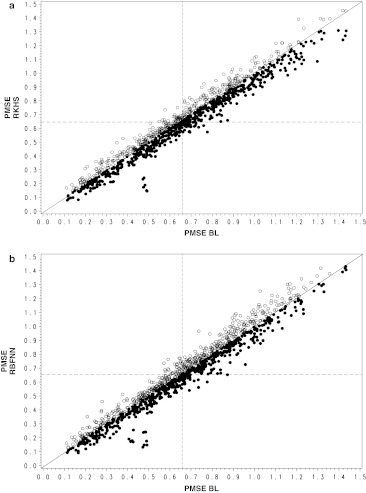
The availability of high density panels of molecular markers has prompted the adoption of genomic selection (GS) methods in animal and plant breeding. In GS, parametric, semi-parametric and non-parametric regressions models are used for predicting quantitative traits. This article shows how to use neural networks with radial basis functions (RBFs) for prediction with dense molecular markers. We illustrate the use of the linear Bayesian LASSO regression model and of two non-linear regression models, reproducing kernel Hilbert spaces (RKHS) regression and radial basis function neural networks (RBFNN) on simulated data and real maize lines genotyped with 55,000 markers and evaluated for several trait-environment combinations. The empirical results of this study indicated that the three models showed similar overall prediction accuracy, with a slight and consistent superiority of RKHS and RBFNN over the additive Bayesian LASSO model. Results from the simulated data indicate that RKHS and RBFNN models captured epistatic effects; however, adding non-signal (redundant) predictors (interaction between markers) can adversely affect the predictive accuracy of the non-linear regression models.


Figures

Fig. 1
Fig. 1
Graphical representation of a single hidden layer feed-forward neural network (NN). In the hidden layer, input variables formula image (formula image markers) are combined using a linear function, formula image (m = 1,…,M), and subsequently transformed using a non-linear activation function, formula image, yielding a set of M (M = number of neurons) inferred scores, formula image. These scores are used in the output layer as basis functions to regress the response using the linear activation function on the data-derived predictors formula image; formula image could be either an identity or any other function
Fig. 2
Fig. 2
Graphical representation of a single hidden layer (Gaussian) radial basis function neural network (RBFNN). In the hidden layer, information from input variables formula image (formula image markers) is first summarized by means of the Euclidean distance between each of the input vectors {x i} with respect to M (data-inferred) (M = number of neurons) centers {c m}, that is formula image. These distances are then transformed using the Gaussian function, formula image, yielding M data-derived scores. These scores are used in the output layer as basis functions for the linear regression, formula image; formula image is usually an identity function
Fig. 3
Fig. 3
Plot of the correlation for each of 50 partitions in each of 21 trait–environment combinations for different combinations of models. In a when the best model is RKHS, this is represented by a white circle; when the best model is BL, this is represented by a black circle. In b when best model is RBFNN, this is represented by a white circle; when the best model is BL, this is represented by a black circle
Fig. 4
Fig. 4
Histograms of the off-diagonal entries of each of the three kernels used (K 1, K 2, K 3) in the RKHS model for the ASI-SS maize data set
Fig. 5
Fig. 5
Plot of the PMSE for each of the 50 partitions in each of 21 trait–environment combinations for different combinations of models. In a when the best model is RKHS, this is represented by a white circle; when the best model is BL, this is represented by a black circle. In b when best model is RBFNN, this is represented by a white circle; when the best model is BL, this is represented by a black circle

References

    1. Bernardo R. Breeding for quantitative traits in plants. Minneapolis: Stemma Press; 2002.
    1. Broomhead DS, Lowe D. Multivariable functional interpolation and adaptive networks. Complex Syst. 1988;2:321–355.
    1. Chen S, Cowan CF, Grant PM. Orthogonal least squares learning algorithms for radial basis function networks. IEEE Trans Neural Netw. 1991;2(2):302–309. doi: 10.1109/72.80341. - DOI - PubMed
    1. Crossa J, de los Campos G, Pérez P, Gianola D, Burgueño J, Araus JL, Makumbi D, Dreisigacker S, Yan J, Arief V, Banziger M, Braun H-J. Prediction of genetic values of quantitative traits in plant breeding using pedigree and molecular markers. Genetics. 2010;186:713–724. doi: 10.1534/genetics.110.118521. - DOI - PMC - PubMed
    1. Crossa J, Pérez P, de los Campos G, Mahuku G, Dreisigacker S, Magorokosho C. Genomic selection and prediction in plant breeding. J Crop Improv. 2011;25(3):239–261. doi: 10.1080/15427528.2011.558767. - DOI

LinkOut - more resources