. 2012 Jul;83(7):681-6.
doi: 10.1136/jnnp-2011-301969. Epub 2012 May 7.

Fluorodeoxyglucose positron emission tomography in anti-N-methyl-D-aspartate receptor encephalitis: distinct pattern of disease

Affiliations

Fluorodeoxyglucose positron emission tomography in anti-N-methyl-D-aspartate receptor encephalitis: distinct pattern of disease

Frank Leypoldt et al. J Neurol Neurosurg Psychiatry. 2012 Jul.

Abstract

Background: Patients with encephalitis associated with antibodies against N-methyl-D-aspartate-receptor antibody (NMDAR-ab) encephalitis frequently show psychotic symptoms, amnesia, seizures and movement disorders. While brain MRI in NMDAR-ab encephalitis is often normal, abnormalities of cerebral glucose metabolism have been demonstrated by positron emission tomography (PET) with 18F-fluorodeoxyglucose(FDG) in a few usually isolated case reports. However, a common pattern of FDG-PET abnormalities has not been reported.

Methods: The authors retrospectively identified six patients with NMDAR-ab encephalitis in two large German centres who underwent at least one whole-body FDG-PET for tumour screening between January 2007 and July 2010. They analysed the pattern of cerebral uptake derived from whole-body PET data for characteristic changes of glucose metabolism compared with controls, and the changes of this pattern during the course of the disease.

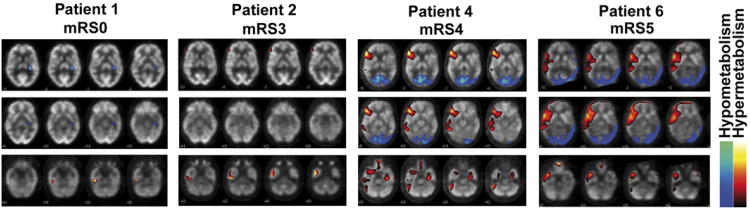
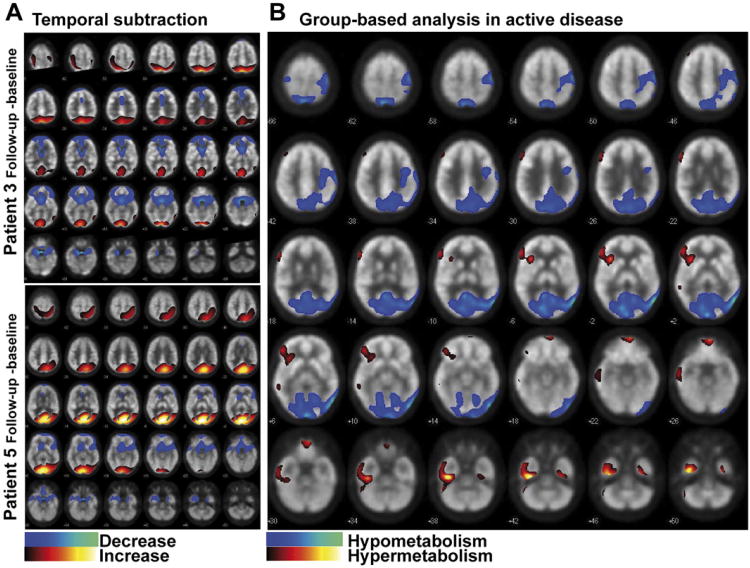
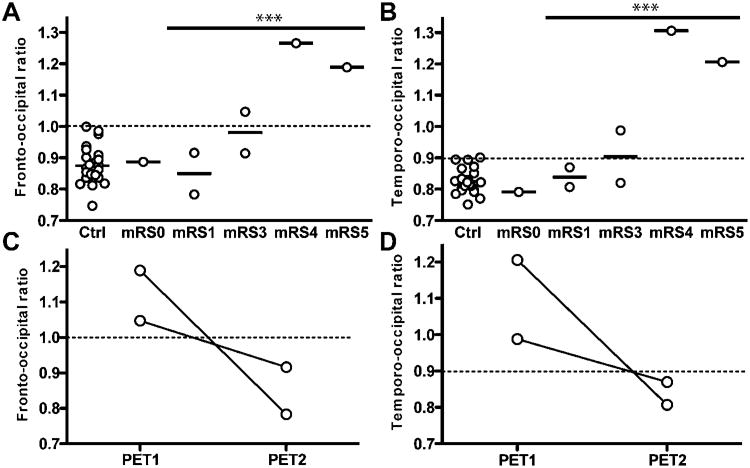
Results: Groupwise analysis revealed that patients with NMDAR-ab encephalitis showed relative frontal and temporal glucose hypermetabolism associated with occipital hypometabolism. Cross-sectional analysis of the group demonstrated that the extent of these changes is positively associated with clinical disease severity. Longitudinal analysis of two cases showed normalisation of the pattern of cerebral glucose metabolism with recovery.

Conclusions: A characteristic change in cerebral glucose metabolism during NMDAR-ab encephalitis is an increased frontotemporal-to-occipital gradient. This pattern correlates with disease severity. Similar changes have been observed in psychosis induced by NMDAR antagonists. Thus, this pattern might be a consequence of impaired NMDAR function.


Conflict of interest statement

Competing interests: FL received honoraria from Abbot and Talecris and research support from the Werner-Otto-Stiftung. IK received speaker honoraria and travel reimbursements from Bayer Healthcare, Biogen Idec, Merck Serono and Novartis, and research funding from Bayer Healthcare and Deutsche Forschungsgesellschaft. JM received honoraria from PETNet, Erlangen, Germany and research support from the Bayerisches Wissenschaftsministerium and BMBF. MG received honoraria from Biogen Idec and research funding from the Landesexzellenzinitiative Hamburg. TM received honoraria from Talecris and research support from the Werner-Otto-Stiftung and Landesexzellenzinitiative Hamburg. JD received royalties from the editorial board of Up-To-Date; from Athena Diagnostics for a patent for the use of Ma2 as autoantibody test. He has received a research grant from Euroimmun, and his contribution to the current work was supported in part by grants from the National Institutes of Health and National Cancer Institute RO1CA89054, 1RC1NS068204-01, and a McKnight Neuroscience of Brain Disorders award. CG received research funding from the Deutsche Forschungs Gemeinschaft. JL received research support by the Thyssen Stiftung. RB discloses no conflicts of interest.

Figures

Figure 1
Figure 1
Representative images of abnormal cerebral glucose metabolism in individual patients with N-methyl-D-aspartate receptor antibody encephalitis detected by 18F-fluoro-2-deoxy-d-glucose positron emission tomography. Patients with mild or moderate clinical severity (patients #1 and #2; mRS ≤3) show temporomesial hyperintensities, whereas more widespread frontal and temporal hyperintensities and occipital hypointensities in patients with severe disease (patients #4 and #6; mRS >3) are observed. Representative sections are shown (all images available in online supplementary figure 1). Significant hyper- and hypometabolism is colour/gray-scale coded as depicted in the legend. mRS, modified Rankin Scale.
Figure 2
Figure 2
Changes upon recovery and the common pattern of abnormal cerebral glucose metabolism in N-methyl-D-aspartate receptor antibodies (NMDAR-ab) encephalitis. (A) Normalisation of 18F-fluoro-2-deoxy-d-glucose positron emission tomography brain metabolism in NMDAR-ab encephalitis in two patients. Subtraction analysis for both patients (baseline vs follow-up; threshold at 2 SDs). Increase/decrease of metabolism upon recovery according to legend. (B) Groupwise analysis of patients with NMDAR-ab encephalitis during active or presymptomatic disease (n=5) compared with controls (n=24; false detection rate<0.05). Significant temporal, frontobasal, cerebellar and right-sided frontal hypermetabolism is detected, as well as occipital and asymmetric parietal hypometabolism.
Figure 3
Figure 3
An increased frontal- and temporal-to-occipital 18F-fluoro-2-deoxy-d-glucose (FDG) uptake is associated with disease severity in N-methyl-D-aspartate receptor antibodies encephalitis. Ratio of mean frontal to mean occipital (A), and of mean temporal to mean occipital FDG uptake (B), in controls and patients by disease severity modified Rankin Scale (mRS). Both ratios are significantly elevated in active disease (mRS >0) compared with controls (unpaired two-tailed t test, p<0.001). (C/D) Normalisation of fronto-occipital and temporo-occipital ratio upon clinical recovery in two individual patients. The upper limit defined as mean ± 2SDs of the control group is depicted as dotted line.

References

    1. Dalmau J, Lancaster E, Martinez-Hernandez E, et al. Clinical experience and laboratory investigations in patients with anti-NMDAR encephalitis. Lancet Neurol. 2011;10:63–74. - PMC - PubMed
    1. Prüss H, Dalmau J, Harms L, et al. Retrospective analysis of NMDA receptor antibodies in encephalitis of unknown origin. Neurology. 2010;75:1735–9. - PubMed
    1. Granerod J, Ambrose HE, Davies NW, et al. UK Health Protection Agency (HPA) Aetiology of Encephalitis Study Group. Causes of encephalitis and differences in their clinical presentations in England: a multicentre, population-based prospective study. Lancet Infect Dis. 2010;10:835–44. - PubMed
    1. Maeder-Ingvar M, Prior JO, Irani SR, et al. FDG-PET hyperactivity in basal ganglia correlating with clinical course in anti-NDMA-R antibodies encephalitis. J Neurol Neurosurg Psychiatry. 2010;32:235–6. - PubMed
    1. Mohr BC, Minoshima S. F-18 fluorodeoxyglucose PET/CT findings in a case of anti-NMDA receptor encephalitis. Clin Nucl Med. 2010;35:461–3. - PubMed

Publication types