

Autophagy inhibitor Lys05 has single-agent antitumor activity and reproduces the phenotype of a genetic autophagy deficiency
- PMID: 22566612
- PMCID: PMC3361415
- DOI: 10.1073/pnas.1118193109
Autophagy inhibitor Lys05 has single-agent antitumor activity and reproduces the phenotype of a genetic autophagy deficiency
Abstract
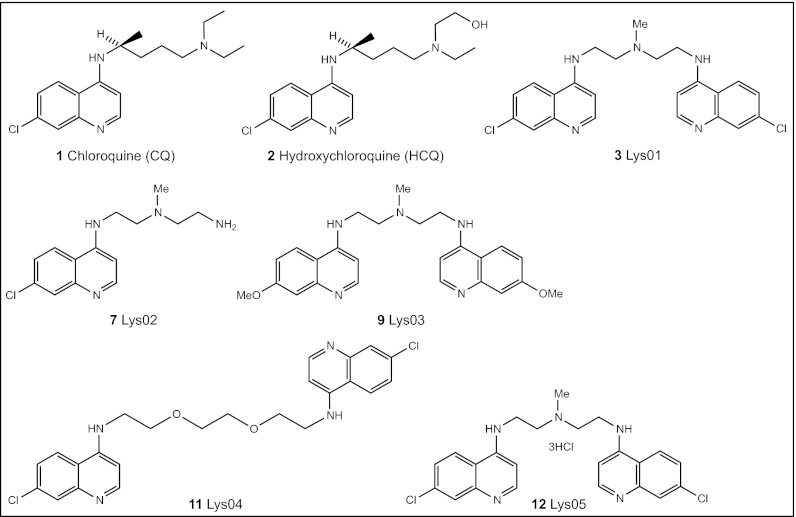
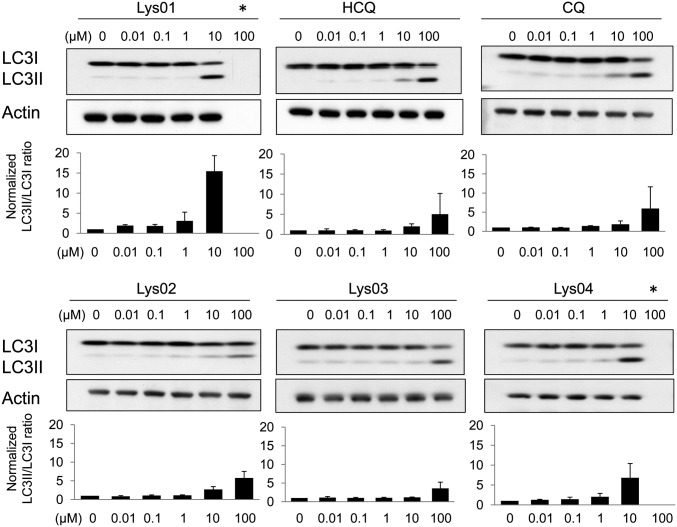
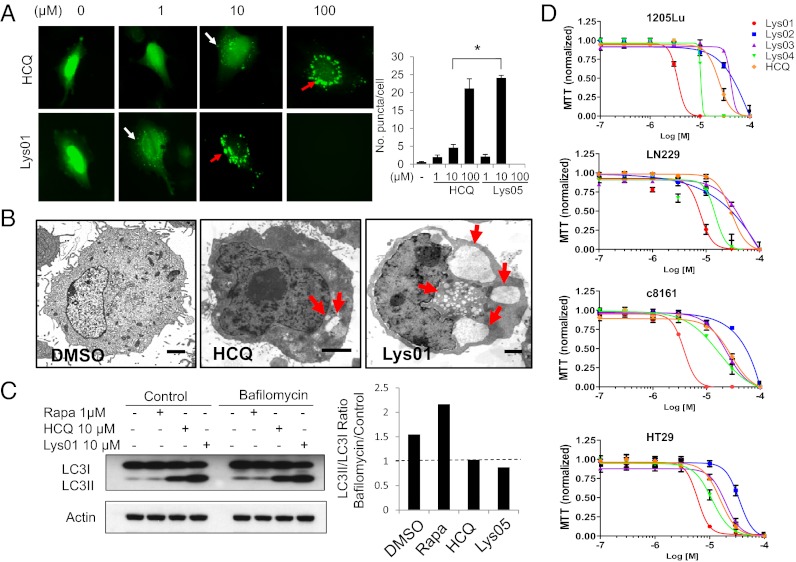
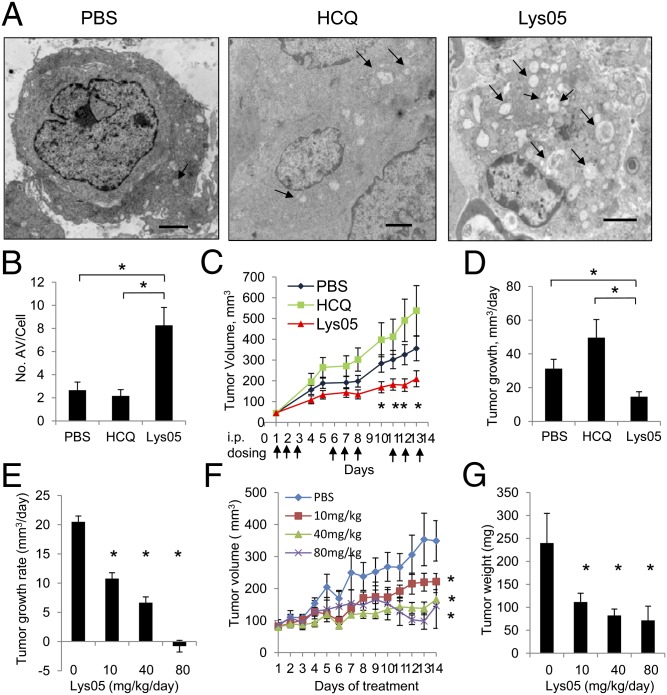
Autophagy is a lysosome-dependent degradative process that protects cancer cells from multiple stresses. In preclinical models, autophagy inhibition with chloroquine (CQ) derivatives augments the efficacy of many anticancer therapies, but CQ has limited activity as a single agent. Clinical trials are underway combining anticancer agents with hydroxychloroquine (HCQ), but concentrations of HCQ required to inhibit autophagy are not consistently achievable in the clinic. We report the synthesis and characterization of bisaminoquinoline autophagy inhibitors that potently inhibit autophagy and impair tumor growth in vivo. The structural motifs that are necessary for improved autophagy inhibition compared with CQ include the presence of two aminoquinoline rings and a triamine linker and C-7 chlorine. The lead compound, Lys01, is a 10-fold more potent autophagy inhibitor than HCQ. Compared with HCQ, Lys05, a water-soluble salt of Lys01, more potently accumulates within and deacidifies the lysosome, resulting in impaired autophagy and tumor growth. At the highest dose administered, some mice develop Paneth cell dysfunction that resembles the intestinal phenotype of mice and humans with genetic defects in the autophagy gene ATG16L1, providing in vivo evidence that Lys05 targets autophagy. Unlike HCQ, significant single-agent antitumor activity is observed without toxicity in mice treated with lower doses of Lys05, establishing the therapeutic potential of this compound in cancer.
Conflict of interest statement
Conflict of interest statement: There is a patent pending that protects the compounds described in this paper and use of the compounds in cancer and other indications. This patent has not been licensed and has generated no revenue to date.
Figures


Similar articles
-
Lys05: a new lysosomal autophagy inhibitor.Autophagy. 2012 Sep;8(9):1383-4. doi: 10.4161/auto.20958. Epub 2012 Aug 10. Autophagy. 2012. PMID: 22878685 Free PMC article.
-
Lys05 induces lysosomal membrane permeabilization and increases radiosensitivity in glioblastoma.J Cell Biochem. 2020 Feb;121(2):2027-2037. doi: 10.1002/jcb.29437. Epub 2019 Oct 23. J Cell Biochem. 2020. PMID: 31642111
-
Ferroquine, the next generation antimalarial drug, has antitumor activity.Sci Rep. 2017 Nov 21;7(1):15896. doi: 10.1038/s41598-017-16154-2. Sci Rep. 2017. PMID: 29162859 Free PMC article.
-
Chloroquine and hydroxychloroquine in antitumor therapies based on autophagy-related mechanisms.Pharmacol Res. 2021 Jun;168:105582. doi: 10.1016/j.phrs.2021.105582. Epub 2021 Mar 26. Pharmacol Res. 2021. PMID: 33775862 Review.
-
Repurposing Chloroquine Analogs as an Adjuvant Cancer Therapy.Recent Pat Anticancer Drug Discov. 2021;16(2):204-221. doi: 10.2174/1574892815666210106111012. Recent Pat Anticancer Drug Discov. 2021. PMID: 33413069 Review.
Cited by
-
Autophagy mediates tolerance to Staphylococcus aureus alpha-toxin.Cell Host Microbe. 2015 Apr 8;17(4):429-40. doi: 10.1016/j.chom.2015.03.001. Epub 2015 Mar 26. Cell Host Microbe. 2015. PMID: 25816775 Free PMC article.
-
Autophagy-related gene 12 (ATG12) is a novel determinant of primary resistance to HER2-targeted therapies: utility of transcriptome analysis of the autophagy interactome to guide breast cancer treatment.Oncotarget. 2012 Dec;3(12):1600-14. doi: 10.18632/oncotarget.742. Oncotarget. 2012. PMID: 23307622 Free PMC article.
-
MiR-142-3p enhances chemosensitivity of breast cancer cells and inhibits autophagy by targeting HMGB1.Acta Pharm Sin B. 2020 Jun;10(6):1036-1046. doi: 10.1016/j.apsb.2019.11.009. Epub 2019 Nov 16. Acta Pharm Sin B. 2020. PMID: 32642410 Free PMC article.
-
Emerging strategies to effectively target autophagy in cancer.Oncogene. 2016 Jan 7;35(1):1-11. doi: 10.1038/onc.2015.99. Epub 2015 Apr 20. Oncogene. 2016. PMID: 25893285 Free PMC article. Review.
-
Targeting autophagy as a therapeutic strategy in pediatric acute lymphoblastic leukemia.Sci Rep. 2024 Feb 18;14(1):4000. doi: 10.1038/s41598-024-54400-6. Sci Rep. 2024. PMID: 38369625 Free PMC article.
References
Publication types
MeSH terms
Substances
Grants and funding
LinkOut - more resources
Full Text Sources
Other Literature Sources
Medical
Miscellaneous
