. 2012 Jun 19;367(1596):1665-79.
doi: 10.1098/rstb.2012.0005.

Predicting organismal vulnerability to climate warming: roles of behaviour, physiology and adaptation

Affiliations

Predicting organismal vulnerability to climate warming: roles of behaviour, physiology and adaptation

Raymond B Huey et al. Philos Trans R Soc Lond B Biol Sci. .

Abstract

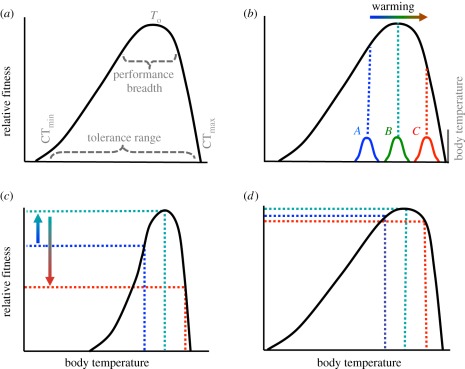
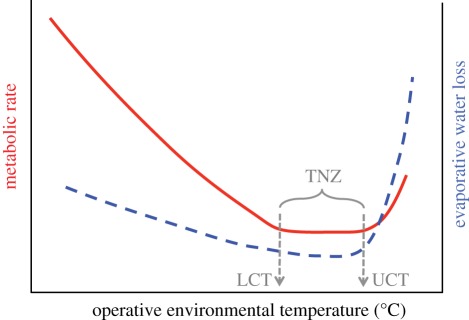
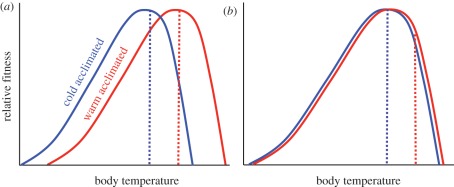
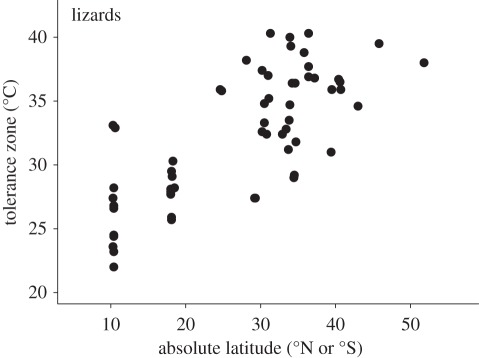
A recently developed integrative framework proposes that the vulnerability of a species to environmental change depends on the species' exposure and sensitivity to environmental change, its resilience to perturbations and its potential to adapt to change. These vulnerability criteria require behavioural, physiological and genetic data. With this information in hand, biologists can predict organisms most at risk from environmental change. Biologists and managers can then target organisms and habitats most at risk. Unfortunately, the required data (e.g. optimal physiological temperatures) are rarely available. Here, we evaluate the reliability of potential proxies (e.g. critical temperatures) that are often available for some groups. Several proxies for ectotherms are promising, but analogous ones for endotherms are lacking. We also develop a simple graphical model of how behavioural thermoregulation, acclimation and adaptation may interact to influence vulnerability over time. After considering this model together with the proxies available for physiological sensitivity to climate change, we conclude that ectotherms sharing vulnerability traits seem concentrated in lowland tropical forests. Their vulnerability may be exacerbated by negative biotic interactions. Whether tropical forest (or other) species can adapt to warming environments is unclear, as genetic and selective data are scant. Nevertheless, the prospects for tropical forest ectotherms appear grim.


Figures

Figure 1.
Figure 1.
(a) Thermal fitness (performance) curve for a hypothetical ectotherm, with key descriptive parameters CTmin, CTmax, tolerance range, performance breadth and optimal temperature (To) identified (adapted from Huey [48]). (b) With climate warming, realized Tb distributions can shift higher. If warming results in Tb that are closer to To of a species (for example Tb shift from A to B), then warming should enhance fitness; but if warming raises Tb above To (e.g. if Tb shifts from B to C), fitness will be reduced (see text). (c,d) Step increases in Tb distributions from warming can have much bigger effects on (c) thermal specialists than on (d) thermal generalists.
Figure 2.
Figure 2.
Effects of environmental temperature on rates of metabolic heat production (red) and of evaporative water loss (blue) of endotherms. At low environmental temperatures, energy expenditures and thus heat production are elevated to balance heat loss. At high ambient temperatures, rates of evaporative water loss are elevated to dump excess heat. Indicated are the thermal neutral zone (TNZ), and the lower (LCT) and upper (UCT) critical temperatures, beyond which metabolic rates increase.
Figure 3.
Figure 3.
Acclimatization to low (blue dotted line) versus high (red dotted line) Tb (simulating an acute climate shift) sometimes induces a phenotypic shift in an ectotherm's thermal fitness curve. (a) Depicts an ectotherm with marked acclimatization capacities. Its elevated To (red) provides some physiological buffering against climate warming (‘Beneficial Acclimation’). (b) Shows an ectotherm with a relatively limited response. If its Tb is elevated by climate warming (red dotted line), its performance will decline.
Figure 4.
Figure 4.
Tolerance zones (CTmax–CTmin; see figure 1a) of lizards increase with absolute latitude. The increase is due primarily to a shift in CTmin (rather than CTmax) with latitude (see text). Note: see Huey et al. [68] for a phylogenetic analyses.
Figure 5.
Figure 5.
Metabolic rate as a percentage of basal metabolic rate (BMR) versus air temperature for Arctic and tropical mammals. Arctic mammals have relatively low LCTs, and thus relatively broad TNZs, assuming that UCTs are independent of latitude. Adapted from Porter & Kearney [26], which was based on the study of Scholander et al. [61,82].
Figure 6.
Figure 6.
Potential proxies for optimal temperatures (To) with lizard data as exemplars: (a) CTmax, (b) mean Tb (field), (c) preferred Tb in laboratory thermal gradients, (d) CTmin and (e) mean maximum daily temperature for the three warmest months. CTmax, Tb and Tp predict To (ac), but CTmin and maximum summer temperatures do not (d,e). Data source: Huey et al. [68].
Figure 7.
Figure 7.
Consequences of differences in ability to compensate behaviourally (or via acclimatization) for climate warming. At the start, assume that mean Te equals mean To, so that the thermal environment is ideal. If Te increases from warming, a species with strong behavioural capacity to thermoregulate (black line) will not experience a marked shift in Tb (and thus no associated selection on thermal sensitivity) for some time. But if warming continues, the species will eventually exceed the limit of behavioural (or physiological) compensation and will then begin to rely on genetic compensatory changes (dashed line), or to go extinct. However, if a species has limited thermoregulatory capacity (dotted grey line), it will soon need to rely on genetic compensation to survive (note: the earlier onset of selection for genetic compensation is not depicted).

References

    1. Parmesan C. 2006. Ecological and evolutionary responses to recent climate change. Annu. Rev. Ecol. Syst. 37, 637–66910.1146/annurev.ecolsys.37.091305.110100 (doi:10.1146/annurev.ecolsys.37.091305.110100) - DOI - DOI
    1. IPCC 2007. Climate change 2007: the physical science basis. Cambridge, UK: Cambridge University Press
    1. Bernardo J., Ossola R. J., Spotila J., Crandall K. A. 2007. Interspecies physiological variation as a tool for cross-species assessments of global warming-induced endangerment: validation of an intrinsic determinant of macroecological and phylogeographic structure. Biol. Lett. 3, 695–69910.1098/rsbl.2007.0259 (doi:10.1098/rsbl.2007.0259) - DOI - DOI - PMC - PubMed
    1. Buckley L. B. 2008. Linking traits to energetics and population dynamics to predict lizard ranges in changing environments. Am. Nat. 171, E1–E1910.1086/523949 (doi:10.1086/523949) - DOI - DOI - PubMed
    1. Williams S. E., Shoo L. P., Isaac J. L., Hoffmann A. A., Langham G. 2008. Towards an integrated framework for assessing the vulnerability of species to climate change. PLoS Biol. 6, 2621–262610.1371/journal.pbio.0060325 (doi:10.1371/journal.pbio.0060325) - DOI - DOI - PMC - PubMed

Publication types

LinkOut - more resources