. 2011 Jul 5:2:27.
doi: 10.3389/fimmu.2011.00027. eCollection 2011.

In vivo T cell activation in lymphoid tissues is inhibited in the oxygen-poor microenvironment

Affiliations

In vivo T cell activation in lymphoid tissues is inhibited in the oxygen-poor microenvironment

Akio Ohta et al. Front Immunol. .

Abstract

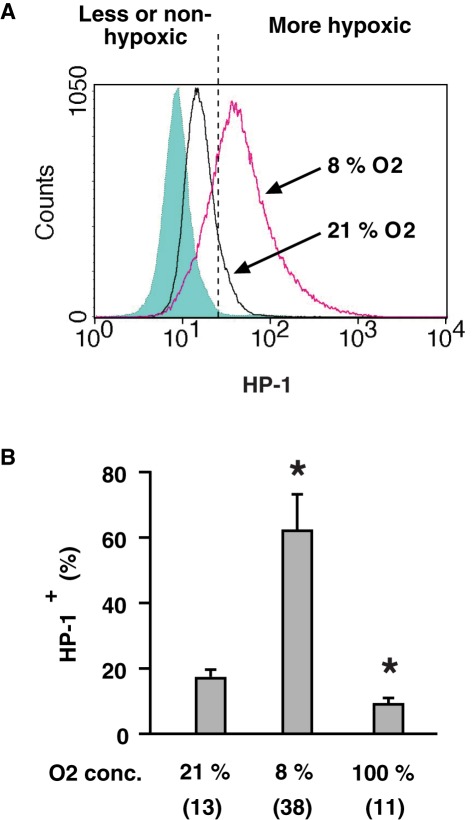
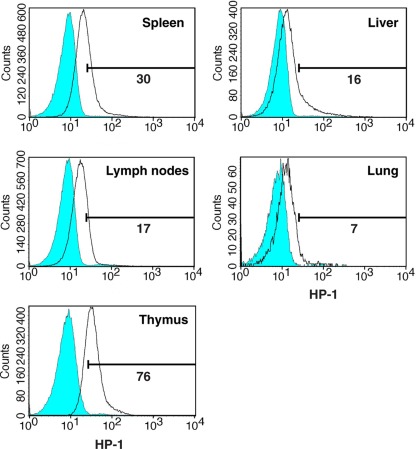
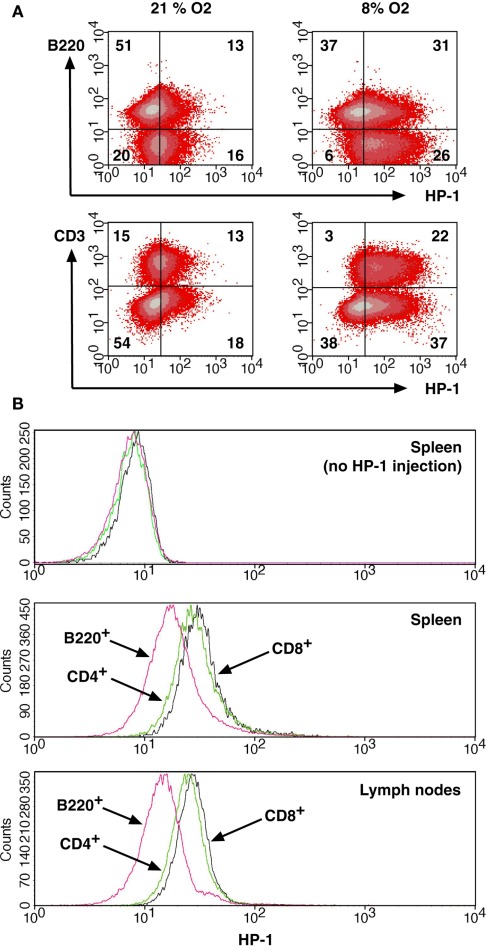
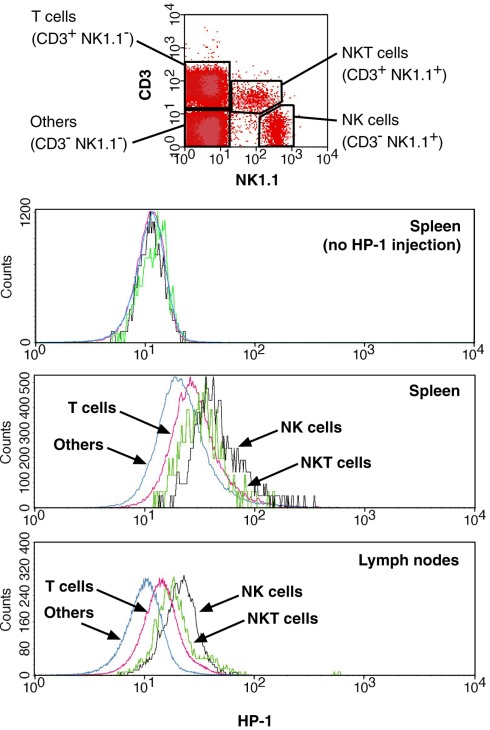
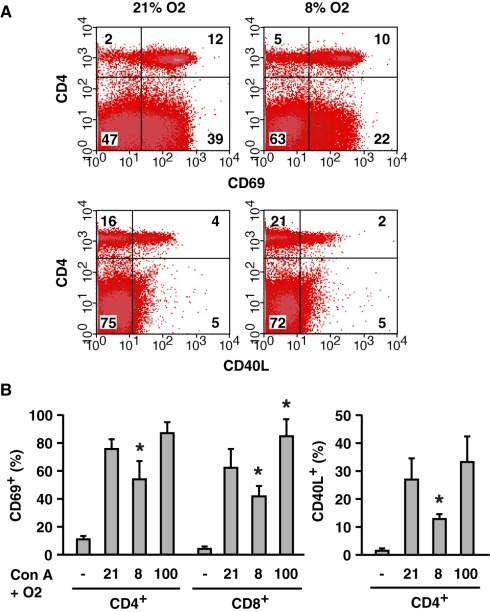
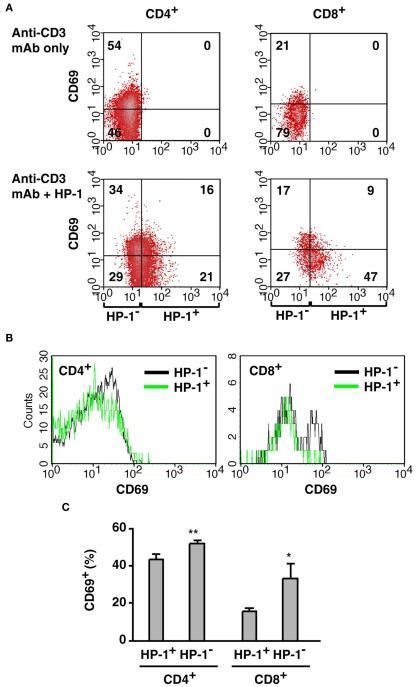
Activation of immune cells is under control of immunological and physiological regulatory mechanisms to ensure adequate destruction of pathogens with the minimum collateral damage to "innocent" bystander cells. The concept of physiological negative regulation of immune response has been advocated based on the finding of the critical immunoregulatory role of extracellular adenosine. Local tissue oxygen tension was proposed to function as one of such physiological regulatory mechanisms of immune responses. In the current study, we utilized in vivo marker of local tissue hypoxia pimonidazole hydrochloride (Hypoxyprobe-1) in the flowcytometric analysis of oxygen levels to which lymphocytes are exposed in vivo. The level of exposure to hypoxia in vivo was low in B cells and the levels increased in the following order: T cells < NKT cells < NK cells. The thymus was more hypoxic than the spleen and lymph nodes, suggesting the variation in the degree of oxygenation among lymphoid organs and cell types in normal mice. Based on in vitro studies, tissue hypoxia has been assumed to be suppressive to T cell activation in vivo, but there was no direct evidence demonstrating that T cells exposed to hypoxic environment in vivo are less activated. We tested whether the state of activation of T cells in vivo changes due to their exposure to hypoxic tissue microenvironments. The parallel analysis of more hypoxic and less hypoxic T cells in the same mouse revealed that the degree of T cell activation was significantly stronger in better-oxygenated T cells. These observations suggest that the extent of T cell activation in vivo is dependent on their localization and is decreased in environment with low oxygen tension.

Keywords: Hypoxyprobe-1; T cell; cytometry; hyperoxia; hypoxia; oxygen; tumor.


Figures

Figure 1
Figure 1
Detection of hypoxic cells by flow cytometry. (A) A representative profile of HP-1 binding to lymphocytes in vivo. After the injection of HP-1, mice were exposed to ambient (21% O2) or hypoxic (8% O2) atmosphere for 2 h. HP-1 binding to spleen cells was detected by FITC-anti-HP-1 mAb. Background level (shadowed peak) was determined using spleen cells obtained from HP-1-uninjected mouse and incubated with FITC-anti-HP-1 mAb. (B) Oxygen dependent changes in HP-1 binding. Spleen cells were analyzed after 2-h exposure of mice to 8, 21, or 100% oxygen. The data represent average ± SD (n = 6). Numbers in parentheses indicate means of median fluorescence intensity. The statistical significance was calculated by Student’s t-test: *P < 0.001.
Figure 2
Figure 2
Degree of hypoxia in lymphocytes in different organs. Mice were treated as described in Figure 1. The spleen, lymph nodes, thymus, liver, and lung were excised and analyzed for HP-1 binding to the cells. Background levels (shadowed peaks) are the staining of cells from HP-1-uninjected mice.
Figure 3
Figure 3
Distribution of B cells and T cells between more and less hypoxic environment. (A) Different levels of HP-1 binding in B cells and T cells. Spleen cells from HP-1-injected mice were stained for HP-1 together with PE-anti-B220 or PE-anti-CD3 mAb. The numbers represent percentage in each quadrant. (B) Spleen and lymph node cells were analyzed for HP-1 binding in CD4+, CD8+, and B220+ cells. Background levels were from HP-1-uninjected mice.
Figure 4
Figure 4
Distribution of NK cells to hypoxic environment. HP-1 binding was analyzed for NK (NK1.1+ CD3), NKT (NK1.1+ CD3+), T (NK1.1 CD3+), and other (NK1.1 CD3) cells. Background levels were from HP-1-uninjected mice.
Figure 5
Figure 5
Oxygen level-mediated regulation of T cell activation in vivo. (A) Inhibition of T cell activation by whole body exposure to hypoxia (8% O2). CD69 and CD40L upregulation on T cells after Con A injection was analyzed. The numbers represent percentage in each quadrant. (B) Induction of CD69 and CD40L in mice exposed to different concentrations of oxygen (8, 21, and 100% O2). Controls (−) were obtained from untreated mice (no Con A, 21% O2). After the injection of Con A, percentages of CD69+ or CD40L+ within CD4+ and CD8+ cells were calculated. The data represent average ± SD (n = 3–6). The statistical significance was calculated by Student’s t-test: *P < 0.05 vs 21% O2.
Figure 6
Figure 6
Preferential activation of T cells in the more oxygenated environment. (A) Correlation of CD69 upregulation with local oxygen levels. Mice received co-injection of HP-1 and anti-CD3 mAb, and CD69 induction on T cells was separately analyzed in HP-1 and HP-1+ cells. The numbers represent percentage in each quadrant. (B) Comparison of CD69 expression in HP-1 and HP-1+ cells. HP-1 fraction contains more CD69+ cells but less CD69 cells than HP-1+ fraction. (C) Both CD4+ and CD8+ cells showed stronger activation in the HP-1 fraction. Percentage of CD69+ cells in CD4+ (CD8+) population was calculated. The data represent average ± SD (n = 4). The statistical significance was calculated by Student’s t-test: *P < 0.01; **P < 0.001.

References

    1. Andersen V., Hellung-Larsen P., Sorensen S. F. (1968). Optimal oxygen tension for human lymphocytes in culture. J. Cell. Physiol. 72, 149–15210.1002/jcp.1040720302 - DOI - PubMed
    1. Arteel G. E., Thurman R. G., Raleigh J. A. (1998). Reductive metabolism of the hypoxia marker pimonidazole is regulated by oxygen tension independent of the pyridine nucleotide redox state. Eur. J. Biochem. 253, 743–75010.1046/j.1432-1327.1998.2530743.x - DOI - PubMed
    1. Arteel G. E., Thurman R. G., Yates J. M., Raleigh J. A. (1995). Evidence that hypoxia markers detect oxygen gradients in liver: pimonidazole and retrograde perfusion of rat liver. Br. J. Cancer 72, 889–89510.1038/bjc.1995.429 - DOI - PMC - PubMed
    1. Atkuri K. R., Herzenberg L. A., Herzenberg L. A. (2005). Culturing at atmospheric oxygen levels impacts lymphocyte function. Proc. Natl. Acad. Sci. U.S.A. 102, 3756–375910.1073/pnas.0409910102 - DOI - PMC - PubMed
    1. Atkuri K. R., Herzenberg L. A., Niemi A. K., Cowan T., Herzenberg L. A. (2007). Importance of culturing primary lymphocytes at physiological oxygen levels. Proc. Natl. Acad. Sci. U.S.A. 104, 4547–455210.1073/pnas.0611732104 - DOI - PMC - PubMed

LinkOut - more resources