. 2011 Sep 12:2:35.
doi: 10.3389/fimmu.2011.00035. eCollection 2011.

Reproducible isolation of lymph node stromal cells reveals site-dependent differences in fibroblastic reticular cells

Affiliations

Reproducible isolation of lymph node stromal cells reveals site-dependent differences in fibroblastic reticular cells

Anne L Fletcher et al. Front Immunol. .

Abstract

Within lymph nodes, non-hematopoietic stromal cells organize and interact with leukocytes in an immunologically important manner. In addition to organizing T and B cell segregation and expressing lymphocyte survival factors, several recent studies have shown that lymph node stromal cells shape the naïve T cell repertoire, expressing self-antigens which delete self-reactive T cells in a unique and non-redundant fashion. A fundamental role in peripheral tolerance, in addition to an otherwise extensive functional portfolio, necessitates closer study of lymph node stromal cell subsets using modern immunological techniques; however this has not routinely been possible in the field, due to difficulties reproducibly isolating these rare subsets. Techniques were therefore developed for successful ex vivo and in vitro manipulation and characterization of lymph node stroma. Here we discuss and validate these techniques in mice and humans, and apply them to address several unanswered questions regarding lymph node composition. We explored the steady-state stromal composition of lymph nodes isolated from mice and humans, and found that marginal reticular cells and lymphatic endothelial cells required lymphocytes for their normal maturation in mice. We also report alterations in the proportion and number of fibroblastic reticular cells (FRCs) between skin-draining and mesenteric lymph nodes. Similarly, transcriptional profiling of FRCs revealed changes in cytokine production from these sites. Together, these methods permit highly reproducible stromal cell isolation, sorting, and culture.

Keywords: endothelial cells; fibroblastic reticular cells; human lymph nodes; lymph node stromal cells; mouse lymph nodes; stromal cells; tolerance.


Figures

Figure 1
Figure 1
Schematic diagram of pooled murine lymph node stromal cell digestion and preparation for cell sorting. 1. Add enzyme mix (RPMI-1640 with 0.8 mg/ml Dispase, 0.2 mg/ml Collagenase P, 0.1 mg/ml DNase I) to tissue, incubate in 37°C waterbath. 2. After 10–20 min (see Materials and Methods), agitate lymph node fragments using 1 ml pipette, then incubate until the fragments settle. 3. Remove the supernatant containing released cells, centrifuge it and store it on ice. 4. Repeat steps 1–3 until all fragments are fully digested (no more than 60 min). 5. Pool all supernatant fractions, centrifuge, filter, and count. 6. Add anti-CD45 microbeads, incubate at 4°C on rotating wheel. 7. Use MACS or AutoMACS to deplete CD45+ cells, count. 8. Stain enriched CD45 stroma with antibodies; sort to high purity using 100 μm tip at 20 psi.
Figure 2
Figure 2
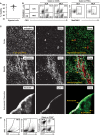
Validation of a low-mortality method for isolation of lymph node stromal subsets. (A) Viability of single cell suspensions prepared using a low-mortality enzymatic digestion method. n = 6, mean + SD. (B) Typical flow cytometric profiles of lymph node stromal subsets freshly isolated from skin-draining or mesenteric lymph nodes of individual mice. (C) Lymph node stromal subsets identified in situ on cryosections. Top panel: T cell zone FRCs (podoplanin+ CD31) and high endothelial venules (podoplaninCD31+ with cuboidal morphology). Two examples of HEVs are designated using arrows. Middle panel: medullary LECs (podoplanin+CD31+) and large medullary blood vessels (podoplaninCD31+). Medullary lymphatic vessel/s are shown using arrows. Bottom panel: Capsular afferent LECs (Lyve-1+ MadCAM+), MRCs (subcapsular, Lyve-1 MadCAM+), and FDCs (follicular, Lyve-1, MadCAM+). Colocalization overlay shown in white on merged images. Original magnification: 200×.(D) Human lymph nodes (non-mesenteric origin) were digested and stained for flow cytometric analysis. Dotplots are representative of n = 4 independent experiments.
Figure 3
Figure 3
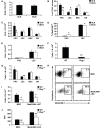
Lymph nodes show site-specific alterations in stromal composition. Lymph nodes from individual C57Bl/6 mice were digested and stained for flow cytometry. (A) Lymph node cellularity. (B) Proportion of CD45 negative lymph node stromal subsets. (C) Number of lymph node stromal subsets. (D) MadCAM+ cells shown as a proportion of total FRCs or LECs. (E) Total number of MadCAM+ FRCs or LECs. (F) Cellularity of skin-draining lymph nodes isolated from age-matched Rag−/− or WT (B6) mice. (G) Number of lymph node stroma from age-matched Rag−/− or WT mice. (H) The proportion, or (I) number of MadCAM+ FRCs (MRCs) or LECs in SLN of age-matched Rag−/− or WT mice. Plots are representative of n = 5 mice. (J) Mean fluorescence intensity (MFI) of MadCAM staining in MRCs or MadCAM+ LECs. WT, wildtype. *P < 0.05; **P < 0.01 Mann–Whitney U-test. n = 5–10 mice from two to three independent experiments.
Figure 4
Figure 4
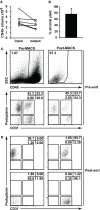
Lymph node stromal cell enrichment and sorting. (A) Skin-draining lymph nodes from 6 to 10 C57Bl/6 mice were enzymatically digested and enriched for CD45 stromal cells using autoMACS. The number of CD45 stroma added to the column (input) and retrieved from the column (output) were charted. Data depict n = 5 independent experiments. (B) Percent stromal cell yield for autoMACS enrichment of stroma was calculated. (C) Flow cytometric profiles of stromal cells pre- and post-autoMACS enrichment. (D) Sorting strategy and post-sort purity for major lymph node stromal cell subsets. Dotplots gated on CD45 propidium iodide stroma.
Figure 5
Figure 5
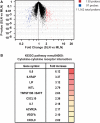
Site-specific transcriptional upregulation of cytokines in FRCs from skin-draining lymph nodes. (A) Microarray analysis comparing FRCs sorted from skin-draining (SLN) or mesenteric lymph nodes (MLN). Dotplot depicts P-value versus fold-change for SLN versus MLN for 15,486 selected probes. Probes upregulated in SLN are shown in red, while probes upregulated in MLN are blue; (P < 0.05 and fold-change > 2; T-test). n = 4–5 independent replicates. (B) Genes enriched in SLNs encoding cytokines and cytokine receptors (KEGG pathway mmu04060; P < 0.015; modified Fisher’s exact test with Benjamini correction). The fold-increase in mean expression in SLNs compared to MLNs is shown.
Figure 6
Figure 6
Three-dimensional (3D) culture of FRCs mimics in vivo function. (A) Lymph nodes were digested, and single cell suspensions put into culture for 5 days, then trypsinized and stained for flow cytometric profiling. Stromal cells were identified using CD45 (left panel), then stained with CD31 and podoplanin (right panel, gated on CD45 stroma). (B) Cultured stromal cells stained for FDC-M1 or a relevant isotype control. (C) CD31 staining in cultured stromal cells harvested using a high trypsin or low trypsin protocol. Dotplots represent n = 3 independent experiments. (D) Cultured stromal cells were harvested, then purified using autoMACS. FRCs, LECs, or mixed FRCs and LECs were plated in 2D (plastic tissue culture plates), or 3D (a matrigel and collagen gel) and cultured for a further 3 days prior to imaging. Original magnification 10×. Images represent n = 2 independent experiments. (E) F-actin (red) and DAPI (green) were used to stain purified FRCs in 2D or 3D to highlight networks. Images represent n = 3 independent experiments. (F) Purified FRCs were placed in 3D culture in a 96 well plate with or without PP2. After 24–36 h, gel contraction was quantified. Images are representative of n = 3 independent experiments. Bar graph depicts mean + SD, P < 0.05, T-test. (G) Purified FRCs were placed in 3D cultured with purified dendritic cells (DCs) or B cells, then images were sequentially acquired every 90 s. Stills from Supplemental Movies 1 (DCs) and 2 (B cells) are shown (upper panel), original magnification: 20×. Lower panel shows a cartoon of the imaged stromal cell (gray) and the relevant migrating leukocyte (blue). (H) Human lymph nodes were digested, and single cell suspensions put into culture for 7 days, then trypsinized and stained for flow cytometric profiling.

References

    1. Ahrendt M., Hammerschmidt S. I., Pabst O., Pabst R., Bode U. (2008). Stromal cells confer lymph node-specific properties by shaping a unique microenvironment influencing local immune responses. J. Immunol. 181, 1898–1907 - PubMed
    1. Ansel K. M., Ngo V. N., Hyman P. L., Luther S. A., Forster R., Sedgwick J. D., Browning J. L., Lipp M., Cyster J. G. (2000). A chemokine-driven positive feedback loop organizes lymphoid follicles. Nature 406, 309–31410.1038/35018581 - DOI - PubMed
    1. Bajenoff M., Egen J. G., Koo L. Y., Laugier J. P., Brau F., Glaichenhaus N., Germain R. N. (2006). Stromal cell networks regulate lymphocyte entry, migration and territoriality in lymph nodes. Immunity 25, 989–100110.1016/j.immuni.2006.10.011 - DOI - PMC - PubMed
    1. Buettner M., Pabst R., Bode U. (2011). Lymph node stromal cells strongly influence immune response suppression. Eur. J. Immunol. 41, 624–63310.1002/eji.201040681 - DOI - PubMed
    1. Cao G., Beyer T. P., Yang X. P., Schmidt R. J., Zhang Y., Bensch W. R., Kauffman R. F., Gao H., Ryan T. P., Liang Y., Eacho P. I., Jiang X. C. (2002). Phospholipid transfer protein is regulated by liver x receptors in vivo. J. Biol. Chem. 277, 39561–3956510.1074/jbc.C100661200 - DOI - PubMed

LinkOut - more resources