. 2011 Sep 20:2:46.
doi: 10.3389/fimmu.2011.00046. eCollection 2011.

Modulation of the inhibitory receptor leukocyte Ig-like receptor 1 on human natural killer cells

Affiliations

Modulation of the inhibitory receptor leukocyte Ig-like receptor 1 on human natural killer cells

Nicholas L Li et al. Front Immunol. .

Abstract

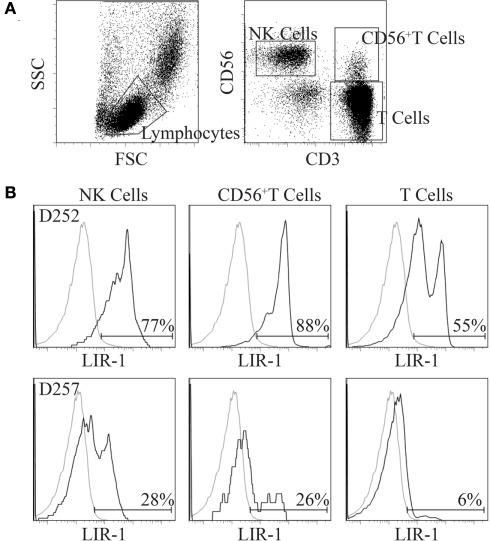
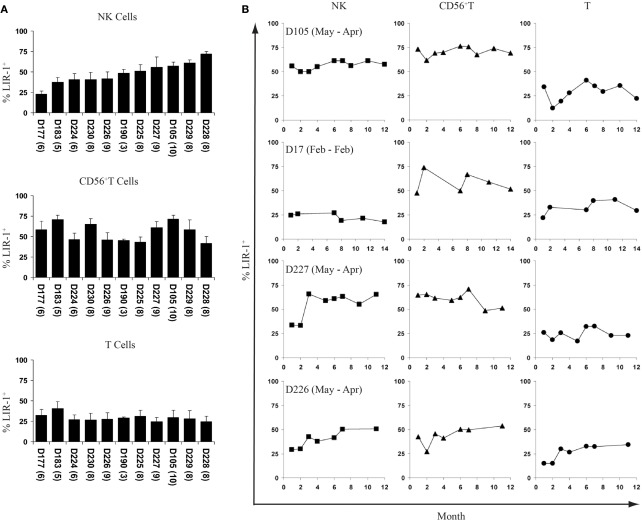
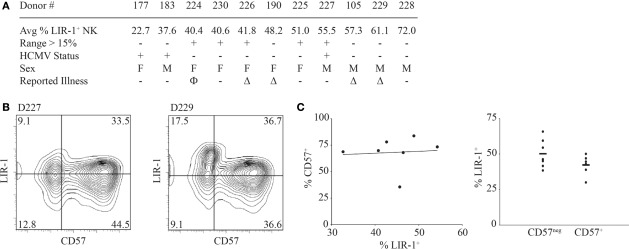
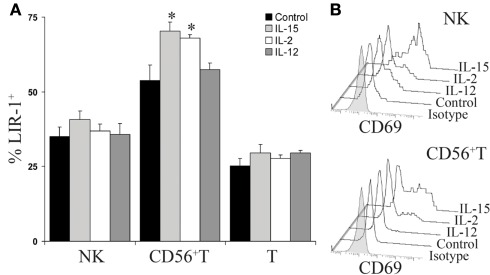
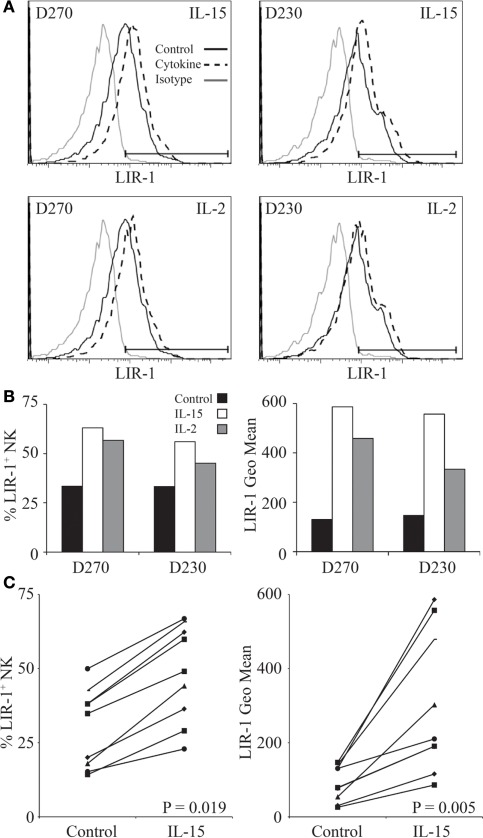
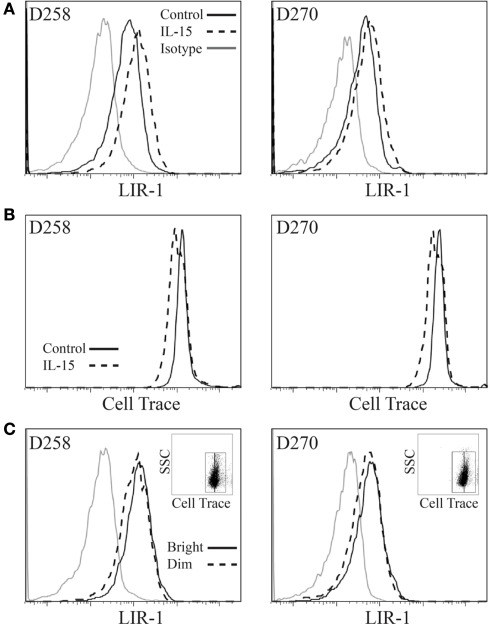
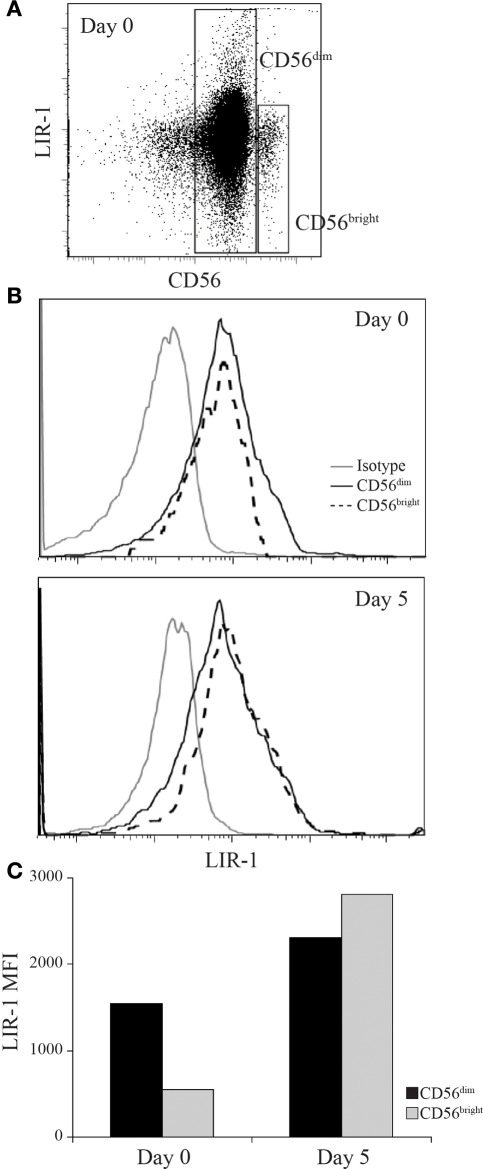
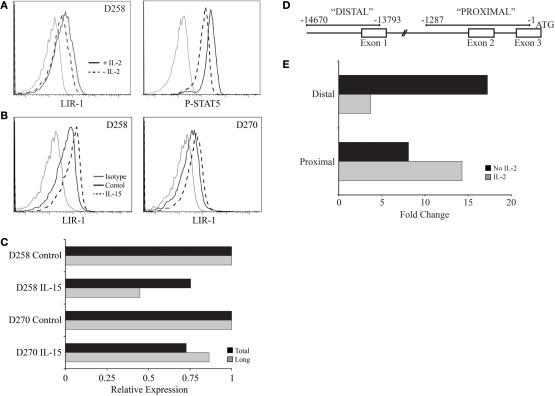
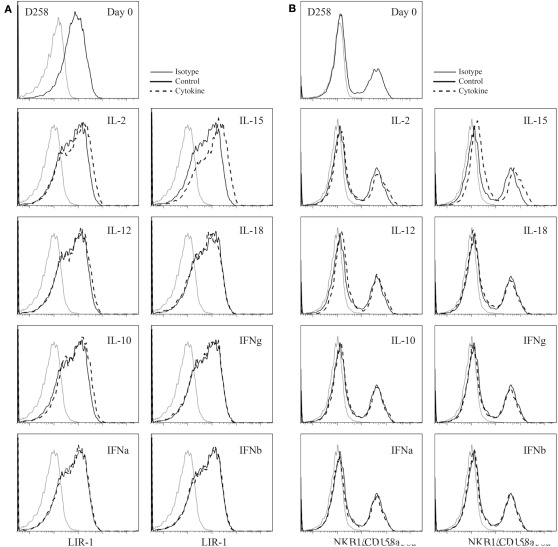
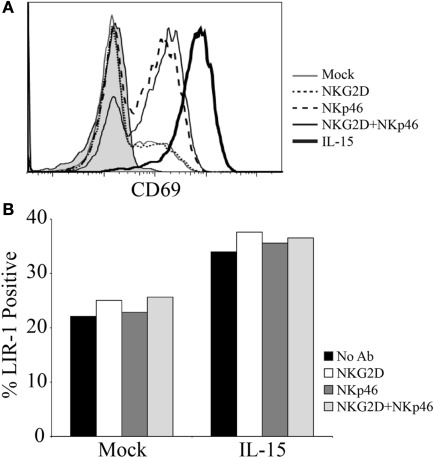
Leukocyte Ig-like receptor 1 (LIR-1) is an inhibitory Ig superfamily receptor with broad specificity for MHC-I expressed on leukocytes including natural killer (NK) and T cells. The extent of LIR-1 expression on NK cells is quite disparate between donors but the regulation of LIR-1 in NK cells is poorly understood. We examined expression profiles of LIR-1 on NK and T lymphocytes in 11 healthy donors over 1 year. Four of the 11 donors demonstrated substantial increases in LIR-1⁺ NK cells. High levels of LIR-1 expression were not correlated with exposure to human cytomegalovirus or the fraction of CD57⁺ NK cells in the donor. LIR-1 levels on ex vivo NK and CD56⁺ T cells were increased in vitro by short term exposure to IL-2 or IL-15 compared to control but not with various other cytokines tested. Sorted CD56(bright) NK cells also increased LIR-1 expression when cultured in IL-2. Maintenance of LIR-1 on longer term NK cells was also dependent on continuous stimulation by IL-15 or IL-2. While we could not detect increases in total LIR-1 mRNA in response to cytokine treatment by qPCR, we observed a shift in activity of LIR-1 promoter reporter constructs in the presence of IL-2 favoring the more translationally active transcript from the proximal promoter. Together these results show LIR-1 on NK cells is under the control of cytokines known to drive NK cell maturation and activation and suggest availability of such cytokines may alter the NK repertoire in vivo as we observed in several donors with fluctuating levels of LIR-1 on their NK cells.

Keywords: LIR-1; inhibitory receptor; natural killer cells.


Figures

Figure 1
Figure 1
Comparison of LIR-1 expression on primary peripheral blood lymphocyte subsets. Freshly isolated PBMC were stained with antibodies to LIR-1, CD3, and CD56. See the Section “Materials and Methods” for details. (A) The gating strategy depicted was used to generate the LIR-1 staining profiles for the three lymphocyte subsets shown. (B) Representative results for a high donor D252 (top row) and a low donor D257 (bottom row) based on NK cell LIR-1 expression are shown.
Figure 2
Figure 2
Fluctuations of LIR-1 expression over time. The frequency of LIR-1 expression in the three lymphocyte subsets were examined on ex vivo PBMC by flow cytometry as depicted in Figure 1 for the panel of donors. (A) The average frequency of LIR-1+ cells for each subset was calculated for each donor for all time points collected. Donors are in order of increasing NK cell LIR-1 expression from left to right. The number of bleeds for each donor is included in parenthesis underneath the x-axis labels. Error bars indicate the SD. (B) LIR-1 frequency in each cell subset with respect to the time of bleed is plotted for representative donors.
Figure 3
Figure 3
Natural killer cell LIR-1 expression, demographics, and maturation. (A) The sex and HCMV status is shown relative to the average percent of LIR-1+ NK cells for the same set of donors in Figure 2. The HCMV status was determined at the end of the study. The “+” indicates positive serology for HCMV (see Materials and Methods for details). All donors fall within the age range of 20–40 years old. For reported illnesses Δ represents common cold symptoms reported and Φ represents reported allergy symptoms at the time of a donation. (B) High LIR-1 expression does not correlate with high CD57 staining. Ex vivo PBL were examined for the co-expression of LIR-1 and CD57 on NK cells as described in the Section “Materials and Methods.” Representative profiles from two donors are shown. (C) The frequency of CD57 is plotted against the frequency of LIR-1 examined on donor NK cells. Each point represents an individual donor (left panel). The proportion of LIR-1 positive cells on CD57+ and CD57neg NK cells from the same donors is shown with the mean frequency indicated (right panel).
Figure 4
Figure 4
IL-15 and IL-2 increase LIR-1+ CD56+T cells in PBMC cultures. (A) Donor peripheral blood mononuclear cells were stimulated ex vivo with IL-15, IL-2, IL-12, or media alone for 24 h and the three lymphocyte subsets were then examined for LIR-1 expression by flow cytometry. Error bars indicate the SEM (n = 5). Representative results for D230 are shown (*P < 0.05). (B) CD69 expression profiles of NK cells and CD56 + T cells following 24 h cytokine stimulation. Representative results from an assay with D230 are shown. T cell histograms are excluded as CD69 expression was not induced over 24 h culture under all conditions.
Figure 5
Figure 5
IL-15 and IL-2 increase LIR-1 expression on purified NK cells. (A) NK cells were isolated from donor PBMC and stimulated ex vivo with IL-15, IL-2, or media alone for 72 h and then examined for LIR-1 expression by flow cytometry. Representative histograms are shown for assays with D270 and D230. (B) The proportion of LIR-1+ NK cells and the geometric mean fluorescence intensity in each sample from the assays with D270 and D230 depicted in (A) with the background subtracted. (C) Changes in LIR-1 expression on NK cells stimulated with IL-15 are shown for various donors. The left panel shows changes in the frequency of LIR-1+ cells while the right hand panel shows the changes in the geometric MFI. The P-values are for the differences in the means between the stimulated and unstimulated samples.
Figure 6
Figure 6
Leukocyte Ig-like receptor 1bright NK cells do not proliferate preferentially in vitro. Expanded NK cell populations were labeled with Cell Trace Violet proliferation dye and then placed in culture in the presence of IL-15 plus low dose IL-2 or low dose IL-2 alone (control) for 72 h and examined by flow cytometry. (A) LIR-1 expression profiles. (B) Cell Trace signal for the same samples as in (A). (C) LIR-1 expression profiles for the IL-15 stimulated NK cell populations depicted in (B) divided into Cell Trace Violet bright and dim populations as shown in insert panel. Representative results from experiments with D258 and D270 are shown (n ≥ 3).
Figure 7
Figure 7
Leukocyte Ig-like receptor 1 expression can be induced on CD56bright NK to match the profile of CD56dim NK cells. D231 NK cells were sorted on day 0 into CD56dim and CD56bright populations and cultured in IL-2 for 5 days. NK cells were provided with fresh IL-2 on day 3. (A) Peripheral blood NK cells were isolated from D231 and examined for CD56 and LIR-1 expression. (B) LIR-1 expression profiles for D231 NK cells as gated in (A) are shown in the upper panel and NK cell LIR-1 expression on both subsets on day 5 are shown in the lower panel. (C) Mean fluorescence intensity of LIR-1 staining from the NK cells shown in (B). Data is representative of two separate experiments with different donors.
Figure 8
Figure 8
IL-2 regulation of pSTAT5 and LIR-1 promoter activity. (A) Activated primary NK cell populations were removed from culture, washed with media, and re-plated in the presence or absence of IL-2 for 48 h. LIR-1 expression and phospho-STAT5 levels were examined following culture by flow cytometry. Representative results for D258 are shown (n ≥ 3). (B) Ex vivo NK cells were cultured in the presence or absence of IL-15 for RNA extraction and qPCR analysis. (C) Representative results from quantitative PCR analysis of the total LIR-1 transcript and the long LIR-1 transcript present in NK cells depicted in (B). Values are normalized to the RPL24 transcript and presented relative to control treated NK cells for each donor. (D) Illustration of the regions used for measuring promoter activity. (E) Differential effect of IL-2 on the activity of the two LIR-1 promoter regions. The luciferase activity was measured in YTS cells cultured in the presence or absence of IL-2 for 38 h. Data is representative of two out of three separate assays.
Figure A1
Figure A1
Cytokine stimulation of activated peripheral blood NK cell populations. (A) Expanded D258 NK cells were rested out of IL-2 for 48 h and placed into culture for 72 h in the presence of low dose IL-2 alone (control) or in combination with the cytokines indicated and examined for LIR-1 expression compared to control. (B) D258 NK cells were cultured as in (A) and examined for pooled KIR expression on day 3.
Figure A2
Figure A2
Triggering activating receptors on NK cells does not increase LIR-1 expression. (A) D183 NK cells were isolated from peripheral blood and purity was assessed by CD56 and CD3 expression (data not shown). Anti-human NKG2D (1D11) and anti-human NKp46 (195314) were used at 10 μg/ml to coat wells of a 96-well plate for NK cell stimulation. NK cells were plated in the presence and absence of IL-15 and incubated for a period of 72 h. On day 3, cells were harvested and examined for expression of CD69. The shaded histogram represents the staining profile with an isotype control antibody. (B) NK cells shown in (A) were co-stained for LIR-1 expression.

References

    1. Anfossi N., Doisne J. M., Peyrat M. A., Ugolini S., Bonnaud O., Bossy D., Pitard V., Merville P., Moreau J. F., Delfraissy J. F., Dechanet-Merville J., Bonneville M., Venet A., Vivier E. (2004). Coordinated expression of Ig-like inhibitory MHC class I receptors and acquisition of cytotoxic function in human CD8+ T cells. J. Immunol. 173, 7223–7229 - PubMed
    1. Apps R., Gardner L., Moffett A. (2008). A critical look at HLA-G. Trends Immunol. 29, 313–32110.1016/j.it.2008.02.012 - DOI - PubMed
    1. Apps R., Gardner L., Sharkey A. M., Holmes N., Moffett A. (2007). A homodimeric complex of HLA-G on normal trophoblast cells modulates antigen-presenting cells via LILRB1. Eur. J. Immunol. 37, 1924–193710.1002/eji.200737089 - DOI - PMC - PubMed
    1. Bellon T., Kitzig F., Sayos J., Lopez-Botet M. (2002). Mutational analysis of immunoreceptor tyrosine-based inhibition motifs of the Ig-like transcript 2 (CD85j) leukocyte receptor. J. Immunol. 168, 3351–3359 - PubMed
    1. Borges L., Hsu M. L., Fanger N., Kubin M., Cosman D. (1997). A family of human lymphoid and myeloid Ig-like receptors, some of which bind to MHC class I molecules. J. Immunol. 159, 5192–5196 - PubMed