. 2012;7(5):e33747.
doi: 10.1371/journal.pone.0033747. Epub 2012 May 2.

Deficiency of C-C chemokine receptor 5 suppresses tumor development via inactivation of NF-κB and upregulation of IL-1Ra in melanoma model

Affiliations

Deficiency of C-C chemokine receptor 5 suppresses tumor development via inactivation of NF-κB and upregulation of IL-1Ra in melanoma model

Ju Kyoung Song et al. PLoS One. 2012.

Abstract

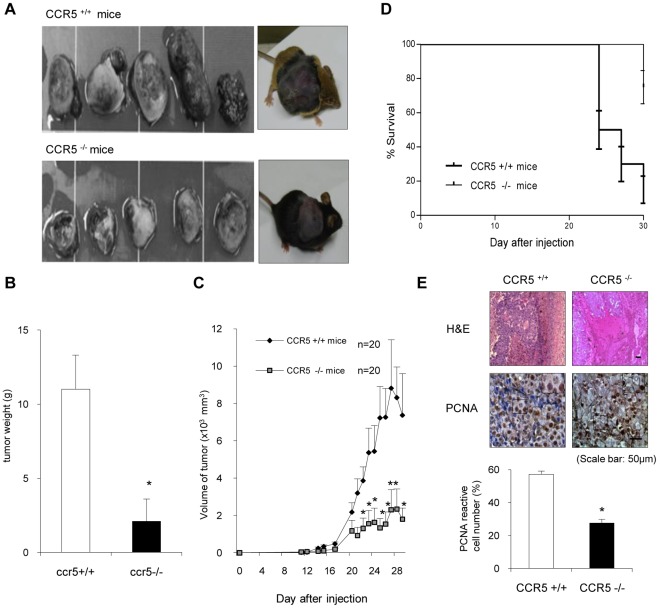
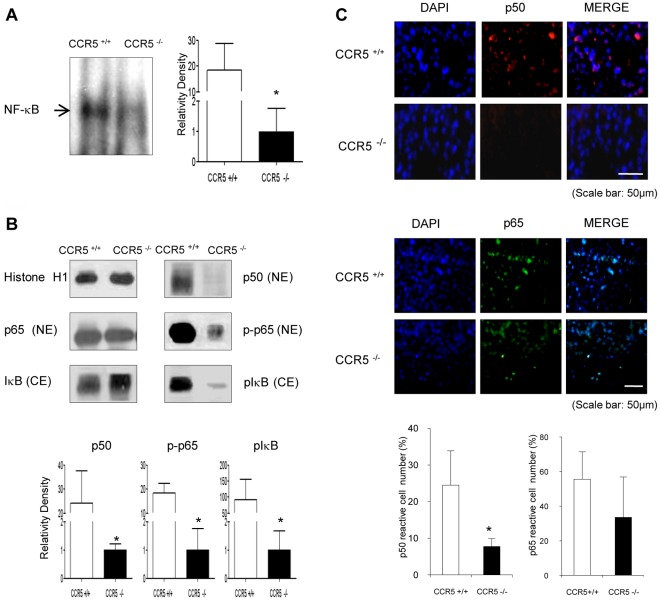
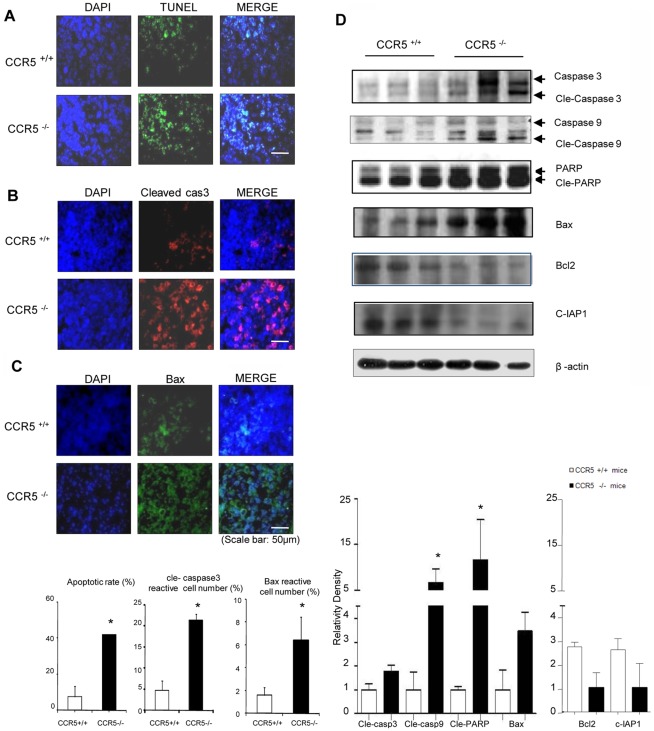
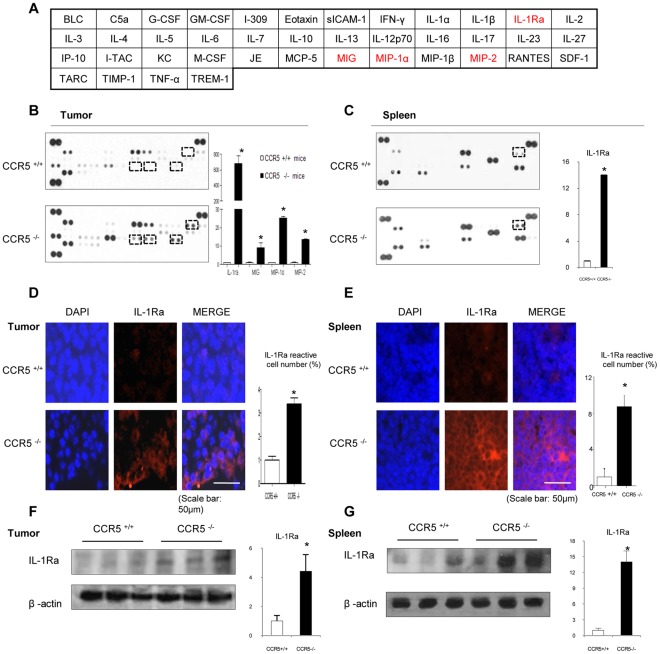
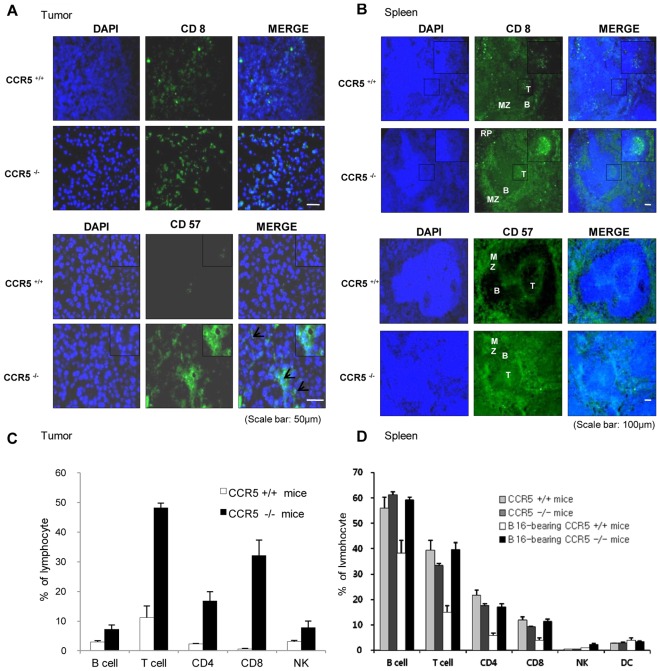
To evaluate the relevance of C-C chemokine receptor type 5 (CCR5) expression and tumor development, we compared melanoma growth in CCR5 knockout (CCR5(-/-)) mice and wild type (CCR5(+/+)) mice. CCR5(-/-) mice showed reduced tumor volume, tumor weight, and increased survival rate when compared to CCR5(+/+) mice. We investigated the activation of NF-κB since it is an implicated transcription factor in the regulation of genes involving cell growth, apoptosis, and tumor growth. Significant inhibition of DNA binding activity of NF-κB, and translocation of p50 and p65 into the nucleus through the inhibition of phosphorylation of IκB was found in the melanoma tissues of CCR5(-/-) mice compared to melanoma tissues of CCR5(+/+) mice. NF-κB target apoptotic protein expression, such as cleaved caspase-3, cleaved PARP, and Bax, was elevated, whereas the survival protein expression levels, such as Bcl-2, C-IAP1, was decreased in the melanoma tissues of CCR5(-/-) mice. Interestingly, we found that the level of IL-1Ra, a tumor growth suppressive cytokine, was significantly elevated in tumor tissue and spleen of CCR5(-/-) mice compared to the level in CCR5(+/+) mice. Moreover, infiltration of CD8(+) cytotoxic T cell and CD57(+) natural killer cells was significantly increased in melanoma tumor and spleen tissue of CCR5(-/-) mice compared to that of CCR5(+/+) mice. Therefore, these results showed that CCR5 deficiency caused apoptotic cell death of melanoma through inhibition of NF-κB and upregulation of IL-1Ra.


Conflict of interest statement

Competing Interests: The authors have declared that no competing interests exist.

Figures

Figure 1
Figure 1. Inhibition of tumor development in CCR5−/− mice.
A–C, Tumor images, volumes, and weights. B16 melanoma cells (5×10⁵ cells/mouse) were inoculated s.c. into CCR5+/+ mice and CCR5−/− mice (n = 20). Tumor volumes were measured every day and tumor weights were measured at study termination (Day 31). The CCR5−/− mice had a significant reduction in tumor growth and volume as compared to CCR5+/+ mice. The results are expressed as mean ± SD. * indicates significant difference from CCR5+/+ mice (P<0.05). D, The CCR5−/− mice demonstrated significantly higher survival rates compared to CCR5+/+ mice (by Log-rank Test). E. Tumor sections were analyzed by H&E stain and expression of proliferating cell nuclear antigen (PCNA) by immunohistochemistry. Data are means ± S.D. of four experimental animals. * indicates significant difference from CCR5+/+ mice (P<0.05). Scale bar indicates 50 m.
Figure 2
Figure 2. Decrease of NF-κB activity in tumor tissue of CCR5−/− mice.
A, The DNA binding activity of NF-κB was determined in the nuclear extracts of the CCR5−/− mice and CCR5+/+ mice tumor tissues by EMSA described in material and methods. B, Expression of p50 and p65 phosphorylation in nuclear extracts (NE), and IκB and IκB phosphorylation in the cytosol (CE) determined by Western blotting. C, Immunolfluorescence analysis of p50 confirmed that the intensities of nuclear staining for p50 were decreased in the tumor tissues of CCR5−/− mice. Data are means ± S.D. of four experimental animals. * indicates significant difference from CCR5+/+ mice (p<0.05). Scale bar indicates 50 µm.
Figure 3
Figure 3. Induction of apoptotic cell death in tumor tissues of CCR5 −/− mice.
A, Apoptotic cells in tumor sections were examined by fluorescence microscopy after DAPI and TUNEL staining as described in material and methods. The apoptotic index was determined as the number of DAPI-stained, TUNEL-positive cells that were counted. Values are the mean ± S.D. of four experimental animals. * indicates statistically significant differences from CCR5+/+ mice. Scale bar indicates 50 µm. B and C, Apoptotic protein (cleaved caspase-3 and Bax) in tumor sections were detected by immunofluorescence assay. The reactive cell number was determined as the number of DAPI-stained, Specific antibody (cleaved caspase-3 and Bax)-positive cells that were counted. Values are the mean ± S.D. of four experimental animals. * indicates statistically significant differences from CCR5+/+ mice. Scale bar indicates 50 µm. D, The expression of apoptotic proteins was detected by Western blotting using specific antibodies; cleaved caspase-3, cleaved caspase-9, cleaved PARP, Bax, Bcl-2 and c-IAP1 in the tumor tissues. The β-actin protein was used as an internal control. Each band is representative of three independent experimental results. Data are means ± S.D. of three experimental animals. * indicates significant difference from CCR5+/+ mice (p<0.05).
Figure 4
Figure 4. Upregulation of IL-1Ra in the tumor and spleen of CCR5−/− mice.
A, Figure 4A indicates mouse cytokine array panel coordinates. Nitrocellulose membranes contain 40 different anti-cytokine antibodies printed in duplicate. B, Mouse cytokine array panel indicate the cytokine expression difference in tumor tissues of CCR5+/+ mice and CCR5−/− mice, especially IL-1Ra. Representative blot from three independent experiments is shown. Positive controls show the manufacturer’s internal positive control samples on the membrane. C, Protein immune-arrays were performed using Mouse cytokine array in spleen tissues. There were differences in cytokines between CCR5+/+ mice and CCR5−/− mice, especially IL-1Ra. Representative blot from three independent experiments is shown. Positive controls show the manufacturer’s internal positive control samples on the membrane. D and E, Immunolfluorescence analysis was used to determine the expression levels of IL-1Ra in tumor and spleen tissues. The reactive cell number was determined as the number of DAPI-stained, IL-1Ra antibody-positive cells that were counted. Values are the mean ± S.D. of four experimental animals. * indicates statistically significant differences from CCR5+/+ mice. Scale bar indicates 50 µm. F and G, Expression of IL-1Ra was analyzed by western blotting in tumor and spleen tissues. Each band is representative of three independent experimental results. Data are means ± S.D. of three experimental animals. * indicates significant difference from CCR5+/+ mice (p<0.05).
Figure 5
Figure 5. Induction of the infiltration of CD8+ T cells and NK cells into tumor, and increase in spleen of CCR5−/− mice.
A and B, Immunolfluorescence analysis was used to determine the expression levels of CD8 (CD8+ cytotoxic T-cell surface marker) and CD57 (NK cell marker) in tumor and spleen sections. The images shown are representative of three separate experiments performed in triplicate. Scale bars indicate 50 µm (A) and 100 µm (B). C and D, Analysis of lymphocyte phenotypes. The tumor and spleen tissues were separated at study termination (Day 31). Flow cytometry analysis was performed using FACSAria flow cytometry, and represent data were shown. Data are means ± S.D. of four experimental animals.

References

    1. Wu X, Lee VC, Chevalier E, Hwang ST. Chemokine receptors as targets for cancer therapy. Curr Pharm Des. 2009;15:742–757. - PubMed
    1. Erreni M, Bianchi P, Laghi L, Mirolo M, Fabbri M, et al. Expression of chemokines and chemokine receptors in human colon cancer. Methods Enzymol. 2009;460:105–121. - PubMed
    1. Seidl H, Richtig E, Tilz H, Stefan M, Schmidbauer U, et al. Profiles of chemokine receptors in melanocytic lesions: de novo expression of CXCR6 in melanoma. Hum Pathol. 2007;38:768–780. - PubMed
    1. Sutton A, Friand V, Brule-Donneger S, Chaigneau T, Ziol M, et al. Stromal cell-derived factor-1/chemokine (C-X-C motif) ligand 12 stimulates human hepatoma cell growth, migration, and invasion. Mol Cancer Res. 2007;5:21–33. - PubMed
    1. Aldinucci D, Lorenzon D, Cattaruzza L, Pinto A, Gloghini A, et al. Expression of CCR5 receptors on Reed-Sternberg cells and Hodgkin lymphoma cell lines: involvement of CCL5/Rantes in tumor cell growth and microenvironmental interactions. Int J Cancer. 2008;122:769–776. - PubMed

Publication types