

Estimating grizzly and black bear population abundance and trend in Banff National Park using noninvasive genetic sampling
- PMID: 22567089
- PMCID: PMC3342321
- DOI: 10.1371/journal.pone.0034777
Estimating grizzly and black bear population abundance and trend in Banff National Park using noninvasive genetic sampling
Erratum in
- PLoS One. 2012;7(5): doi/10.1371/annotation/47e6e4a4-006e-4423-8b78-85d405e97333
Abstract
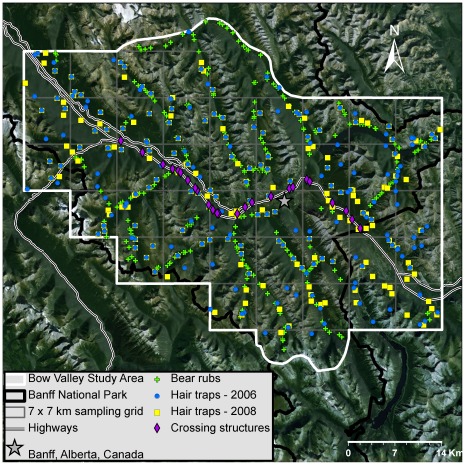
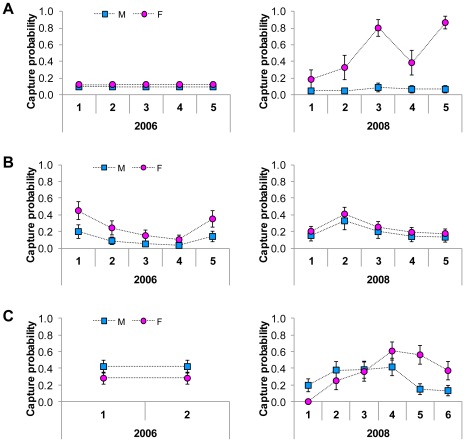
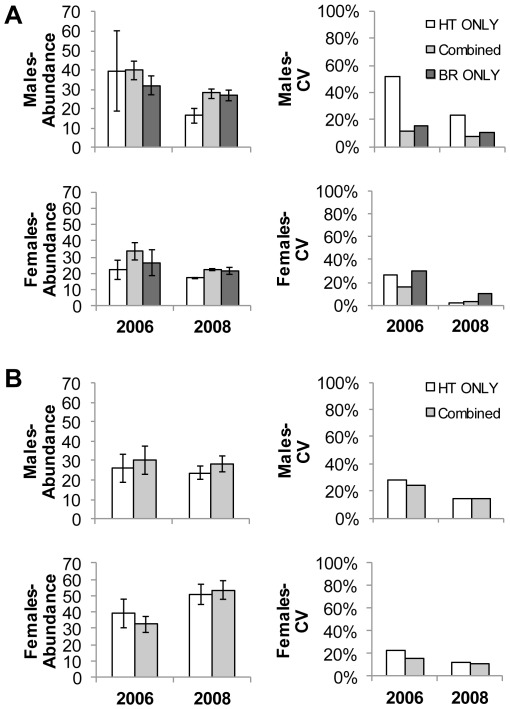
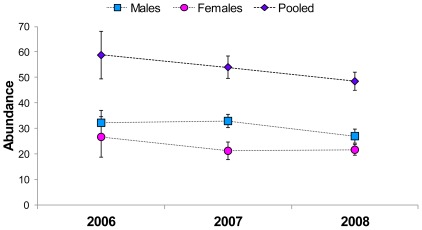
We evaluated the potential of two noninvasive genetic sampling methods, hair traps and bear rub surveys, to estimate population abundance and trend of grizzly (Ursus arctos) and black bear (U. americanus) populations in Banff National Park, Alberta, Canada. Using Huggins closed population mark-recapture models, we obtained the first precise abundance estimates for grizzly bears (N= 73.5, 95% CI = 64-94 in 2006; N= 50.4, 95% CI = 49-59 in 2008) and black bears (N= 62.6, 95% CI = 51-89 in 2006; N= 81.8, 95% CI = 72-102 in 2008) in the Bow Valley. Hair traps had high detection rates for female grizzlies, and male and female black bears, but extremely low detection rates for male grizzlies. Conversely, bear rubs had high detection rates for male and female grizzlies, but low rates for black bears. We estimated realized population growth rates, lambda, for grizzly bear males (λ= 0.93, 95% CI = 0.74-1.17) and females (λ= 0.90, 95% CI = 0.67-1.20) using Pradel open population models with three years of bear rub data. Lambda estimates are supported by abundance estimates from combined hair trap/bear rub closed population models and are consistent with a system that is likely driven by high levels of human-caused mortality. Our results suggest that bear rub surveys would provide an efficient and powerful means to inventory and monitor grizzly bear populations in the Central Canadian Rocky Mountains.
Conflict of interest statement
Figures
References
-
- Estes JA, Terbough J, Brashares JS, Power ME, Berger J, et al. Trophic downgrading of planet Earth. Science. 2011;333:301–306. - PubMed
-
- Long RA, Mackay P, Zielinski WJ, Ray JC, editors. Island Press, Washington, DC 20009, USA; 2008. Noninvasive survey methods for carnivores.
-
- Van der Putten WH, de Ruiter PC, Bezemer TM, Harvey JA, Wassen M, et al. Trophic interactions in a changing world. Basic and Appl Ecol. 2004;5:487–494.
-
- Hayward MW. Conservation management for the past, present, and future. Biodiver Conserv. 2009;18:765–775.
-
- Harris RB, Schwartz CC, Mace RD, Haroldson MA. Study design and sampling intensity for demographic analyses of bear populations. Ursus. 2011;22:24–36.
Publication types
MeSH terms
LinkOut - more resources
Full Text Sources
