

Protecting endangered species: do the main legislative tools work?
- PMID: 22567111
- PMCID: PMC3342297
- DOI: 10.1371/journal.pone.0035730
Protecting endangered species: do the main legislative tools work?
Abstract
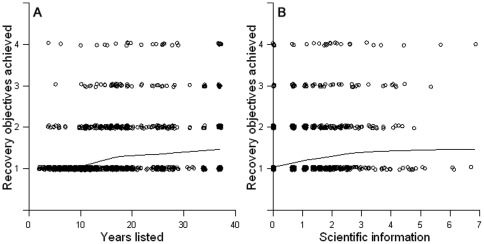
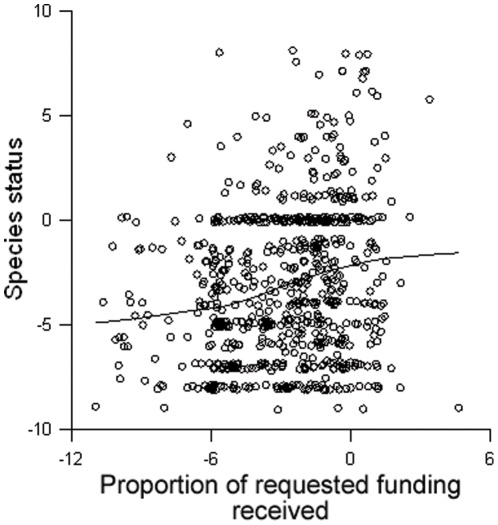
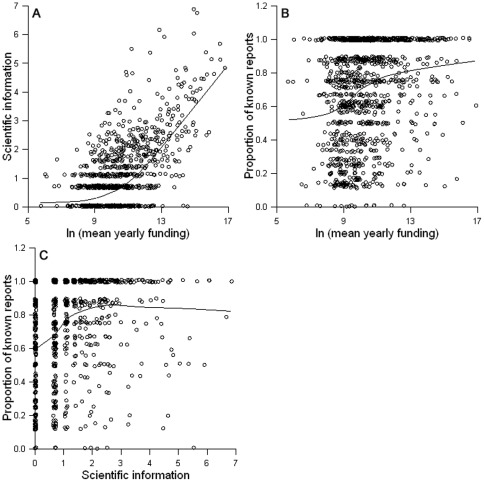
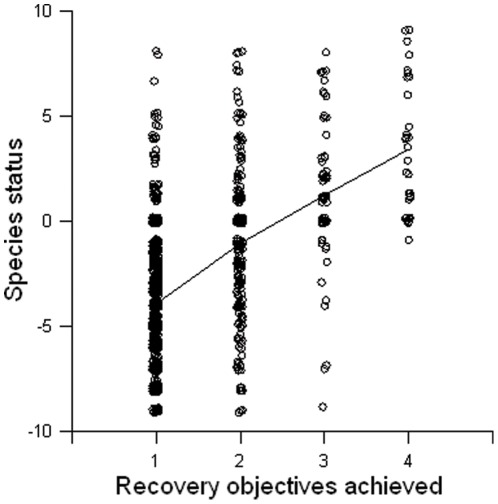
It is critical to assess the effectiveness of the tools used to protect endangered species. The main tools enabled under the U.S. Endangered Species Act (ESA) to promote species recovery are funding, recovery plan development and critical habitat designation. Earlier studies sometimes found that statistically significant effects of these tools could be detected, but they have not answered the question of whether the effects were large enough to be biologically meaningful. Here, we ask: how much does the recovery status of ESA-listed species improve with the application of these tools? We used species' staus reports to Congress from 1988 to 2006 to quantify two measures of recovery for 1179 species. We related these to the amount of federal funding, years with a recovery plan, years with critical habitat designation, the amount of peer-reviewed scientific information, and time listed. We found that change in recovery status of listed species was, at best, only very weakly related to any of these tools. Recovery was positively related to the number of years listed, years with a recovery plan, and funding, however, these tools combined explain <13% of the variation in recovery status among species. Earlier studies that reported significant effects of these tools did not focus on effect sizes; however, they are in fact similarly small. One must conclude either that these tools are not very effective in promoting species' recovery, or (as we suspect) that species recovery data are so poor that it is impossible to tell whether the tools are effective or not. It is critically important to assess the effectiveness of tools used to promote species recovery; it is therefore also critically important to obtain population status data that are adequate to that task.
Conflict of interest statement
Figures
References
-
- Pullin AS, Knight TM. Doing more good than harm - Building an evidence-base for conservation and environmental management. Biol Cons. 2009;142:931–934.
-
- Gosnell H. Section 7 of the endangered species act and the art of compromise: The evolution of a reasonable and prudent alternative for the Animas-La Plata Project. Natural Res J. 2001;41:561–626.
-
- Salzman J. Evolution and Application of Critical Habitat under the Endangered Species Act. Harv Envtl L Rev. 1990;14:311–342.
-
- Schwartz MW. The Performance of the Endangered Species Act. Ann Rev Ecol Evol Syst. 2008;39:279–299.
-
- Thompson BH., Jr Globe DD, Scott JM, Davis FW, editors. Managing the working landscape. 2006. pp. 101–126. The Endangered Species Act at Thirty: Renewing the Conservation Promise: Island Press, Washington, DC.
Publication types
MeSH terms
LinkOut - more resources
Full Text Sources
