. 2012;7(5):e36352.
doi: 10.1371/journal.pone.0036352. Epub 2012 May 2.

Disease dynamics in a specialized parasite of ant societies

Affiliations

Disease dynamics in a specialized parasite of ant societies

Sandra B Andersen et al. PLoS One. 2012.

Abstract

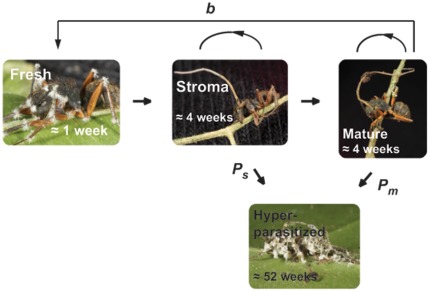
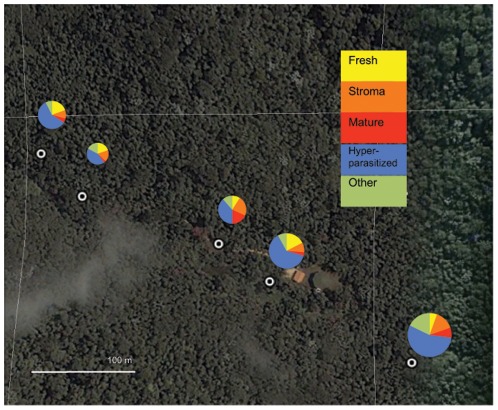
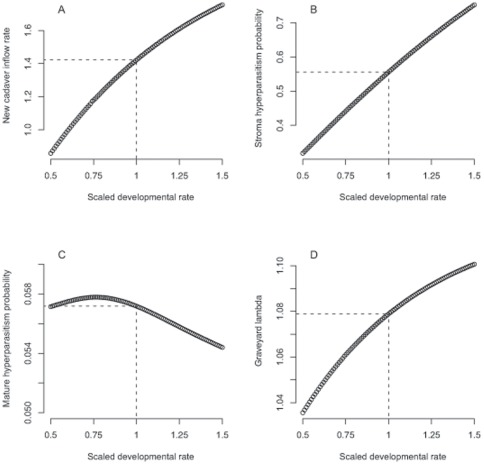
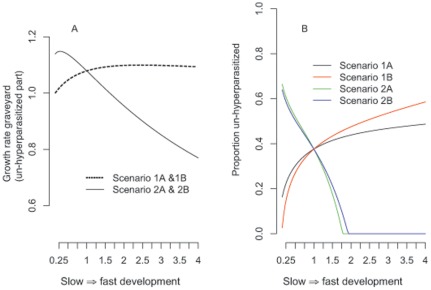
Coevolution between ant colonies and their rare specialized parasites are intriguing, because lethal infections of workers may correspond to tolerable chronic diseases of colonies, but the parasite adaptations that allow stable coexistence with ants are virtually unknown. We explore the trade-offs experienced by Ophiocordyceps parasites manipulating ants into dying in nearby graveyards. We used field data from Brazil and Thailand to parameterize and fit a model for the growth rate of graveyards. We show that parasite pressure is much lower than the abundance of ant cadavers suggests and that hyperparasites often castrate Ophiocordyceps. However, once fruiting bodies become sexually mature they appear robust. Such parasite life-history traits are consistent with iteroparity--a reproductive strategy rarely considered in fungi. We discuss how tropical habitats with high biodiversity of hyperparasites and high spore mortality has likely been crucial for the evolution and maintenance of iteroparity in parasites with low dispersal potential.


Conflict of interest statement

Competing Interests: The authors have declared that no competing interests exist.

Figures

Figure 1
Figure 1. Idealized parasite life-cycle.
Boxes indicate life stages (fresh, stroma, mature and hyperparasitized) and arrows indicate transitions between stages. New cadavers enter the system with birth rate b and remain in the ‘fresh’ stage for a week on average. They then move to the ‘stroma’ life stage and stay there for an average of four weeks, during which a proportion is lost to the ‘hyperparasitized’ life stage at rate Ps. Those individuals that move to the mature stage spend on average four weeks there, during which a proportion is lost to the ‘hyperparasitized’ life stage at rate Pm. Individuals in the hyperparasitized stage remain on here for an average of 52 weeks before being lost.
Figure 2
Figure 2. Graveyard location and cadaver distribution.
Aerial photo (from GoogleEarth) of the sampling area in Mata do Paraíso with the five graveyards marked and the distribution of parasite life stages plotted as pie charts. A total of 432 dead infected ants were encountered, distributed with 41, 35, 44, 149 & 163 individuals, respectively, in graveyard 1–5.
Figure 3
Figure 3. Sensitivity analysis of the estimated life-history parameters.
The analysis was based on the stage structured graveyard growth model that fitted the empirical data best. Panel A: the new cadaver inflow rate b, panel B: the hyperparasitism rate in the stromal life state Ps, panel C: the hyperparasitism rate in the mature life stage Pm, Panel D: the graveyard growth rate λ. The variation in fungal developmental rate from 50% to 150% is plotted along the x-axes, relative to the average fungal development rate that was estimated from the field data (here represented by the relative value of 1). Dashed lines connect the expected mean for the y-axis estimate with this overall mean development rate.
Figure 4
Figure 4. Modelling of graveyard growth rate and degree of hyperparasitism.
Graveyard growth rate λ (panel A) and proportion of cadavers non-hyperparasitized (panel B) as a function of developmental rate (x-axis) for the four different modelled scenarios. The variation in fungal developmental rate from .25% to 400% is plotted along the x-axes, relative to the average fungal development rate that was estimated from the field data (here represented by the relative value of 1). Panel A: The graveyard growth rate, which only accounts for the non-hyperparasitized individuals, is identical in scenario 1A and 1B, and is >1 across all developmental rates but peaks at fast to intermediate developmental rate. Scenario 2A and B are also identical, with negative growth rates at fast development rates but peaks with growth rates >1 at intermediate to slow developmental rates. Panel B: The four scenarios differ in the proportion of non-hyperparasitized cadavers across the developmental range. Scenario 1A and 1B have high rates of hyperparasitism at slow developmental rates. Note that as development rates increase, a greater proportion of cadavers escape hyper-parasitism in scenario 1B due to the faster senescence of the hyperparasitized cadavers. Scenario 2A and 2B show have increasing rates of hyperparasitism as the developmental rate increases due to the relative decrease in the inflow of new cadavers.

References

    1. Poulin R. 2007. Evolutionary ecology of parasites: Princeton University Press.
    1. Schmid-Hempel P. 2011. Evolutionary Parasitology: Oxford University Press.
    1. Poulin R. Brockmann HJ, editor. Parasite manipulation of host behavior: An update and frequently asked questions. 2010. pp. 151–186. Advances in the Study of Behavior: Academic Press.
    1. Hoover K, Grove M, Gardner M, Hughes DP, McNeil J, et al. A gene for an extended phenotype. Science. 2011;333:1401. - PubMed
    1. Sung GH, Hywel-Jones NL, Sung JM, Luangsa-ard JJ, Shrestha B, et al. Phylogenetic classification of Cordyceps and the clavicipitaceous fungi. Stud Mycol. 2007;57:5–59. - PMC - PubMed

Publication types