. 2011:2011:580864.
doi: 10.1155/2011/580864. Epub 2011 Jul 19.

Hip anatomy and ontogeny of lower limb musculature in three species of nonhuman primates

Affiliations

Hip anatomy and ontogeny of lower limb musculature in three species of nonhuman primates

Jeremy J Baker et al. Anat Res Int. 2011.

Abstract

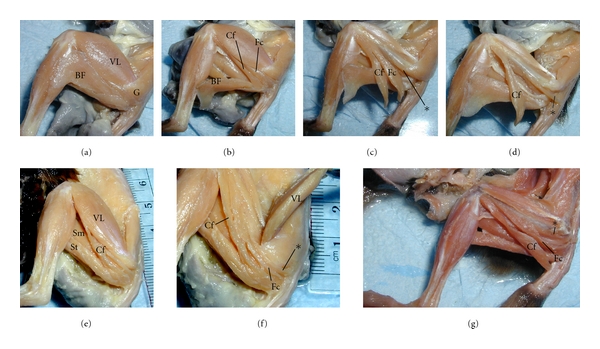
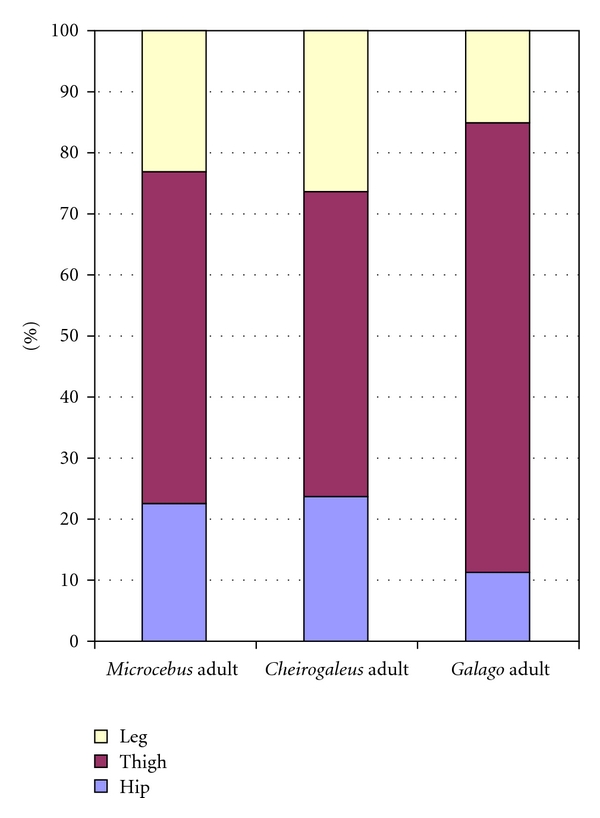
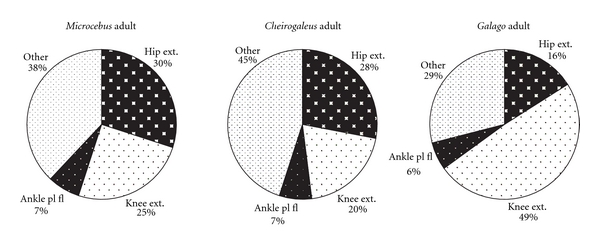
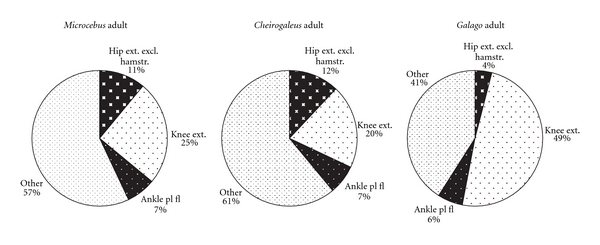
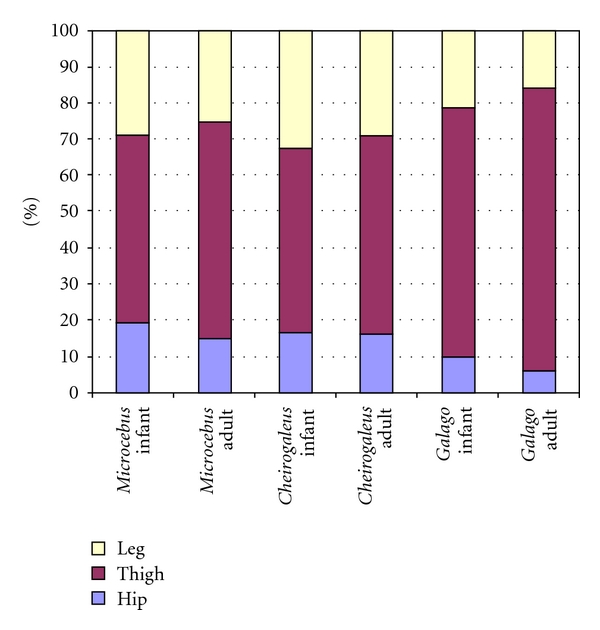
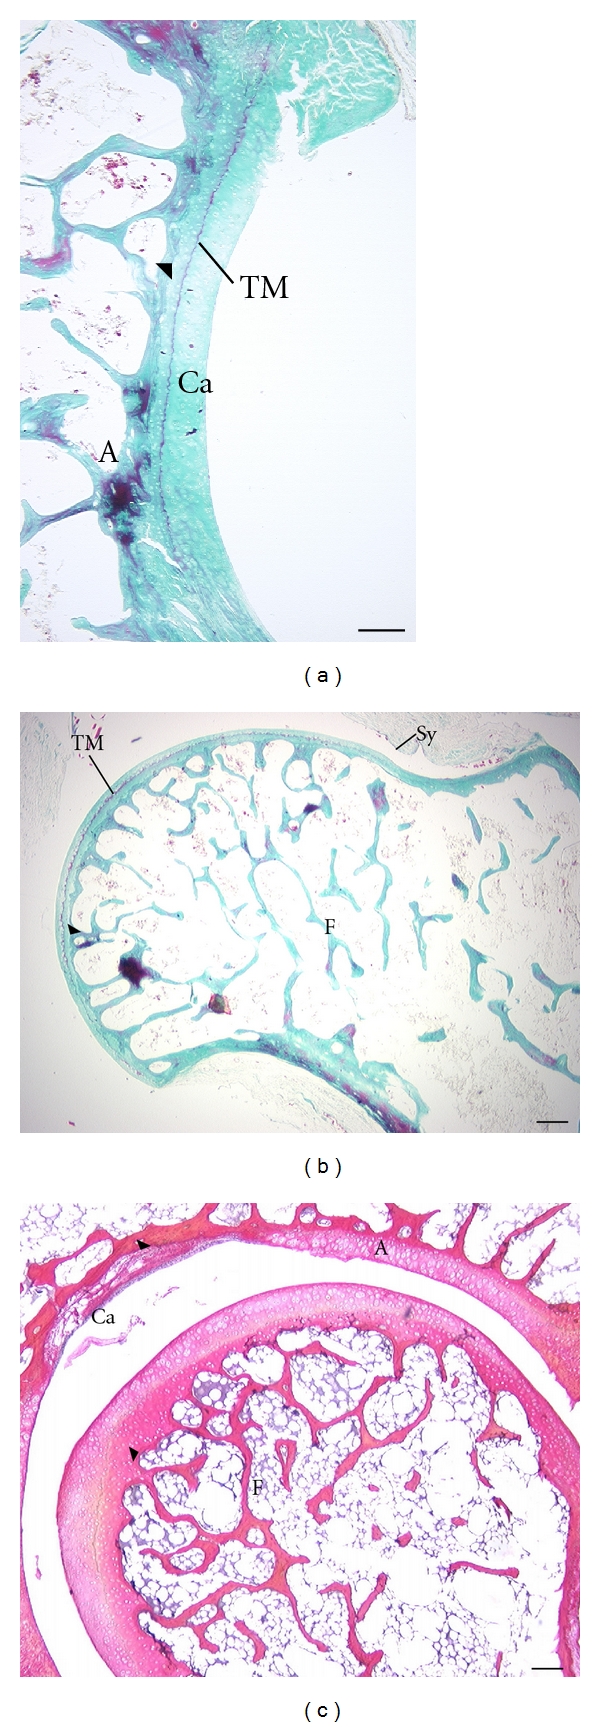
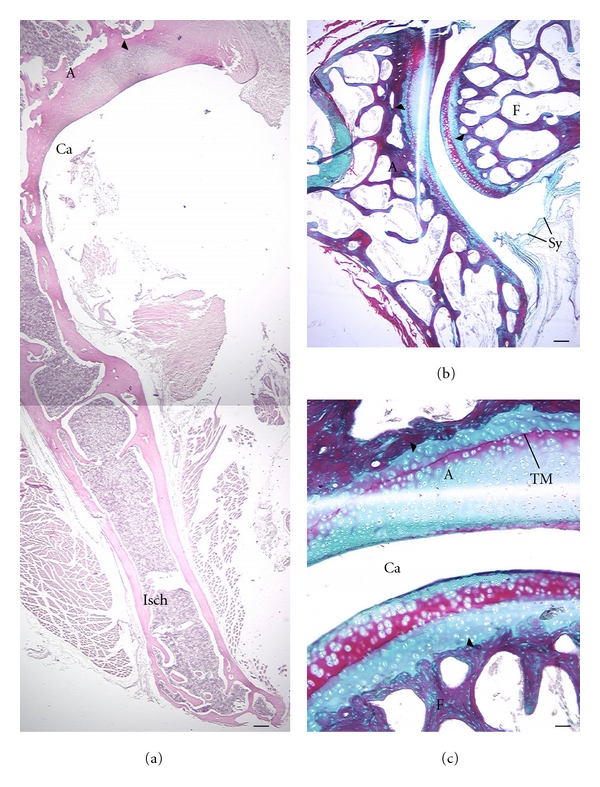
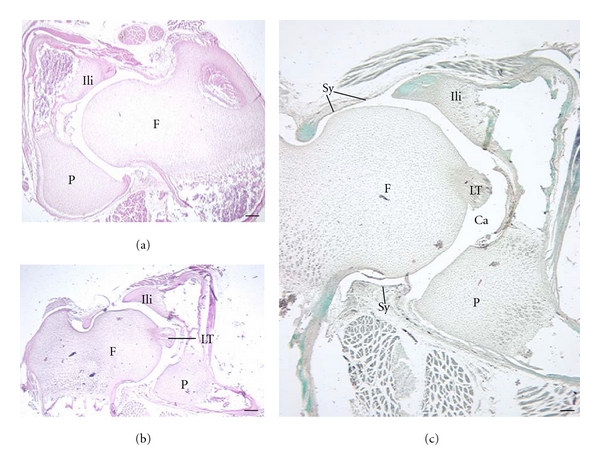
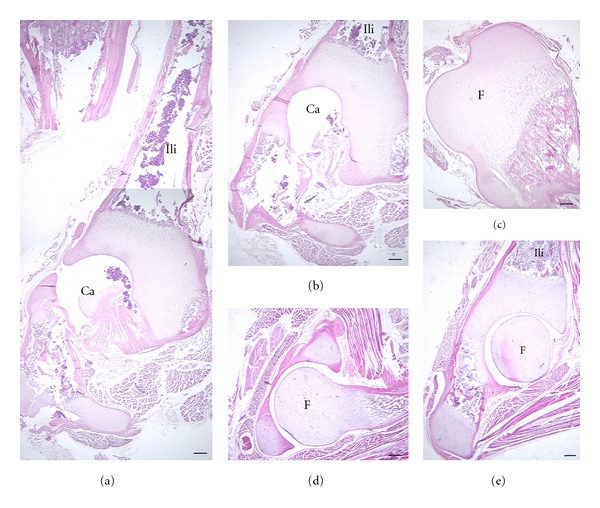
The hip region is examined to determine what aspects of musculoskeletal anatomy are precociously developed in primate species with highly specialized modes of locomotion. Muscles of the hind limb were removed and weighed in each specimen, and the hip joint of selected specimens was studied in stained serial sections. No perinatal differences among species are evident, but in adults, the hip joint of Galago moholi (a leaping specialist) appears to have proportionally thick articular cartilage (relative to the subchondral plate) compared to two species of cheirogaleids. Muscle mass distribution in the hind limbs confirms previous observations that the quadriceps femoris muscle is especially large in Galago (in percent mass of the entire hind limb), while the hip region is smaller compared to the more quadrupedal cheirogaleids. Across age groups, the species with the least specialized locomotion as adults, Cheirogaleus medius, shows little or no change in proximal to distal percentage distribution of muscle mass. Galago has a larger percentage mass gain in the thigh. We suggest that muscle mass gain to specific limb segments may be a critical milestone for primates with extremely specialized modes of locomotion.


Figures

Figure 1
Figure 1
Gross organization of the hip musculature in Microcebus murinus, lateral view of left hind limb. (a)–(d) show a single adult specimen at various stages of dissection. (a) The thigh musculature is intact, showing the large vastus lateralis (VL) balanced by a large biceps femoris (BF). These muscles partially obscure the posterior portion of gluteal musculature (G). (b) BF removed, exposing the caudofemoralis (Cf) and femorcoccygeus (Fc). (c) When the Fc is removed, additional musculature remains (*), running parallel, but deep to the Fc. (d) This muscle is shown with its sacral point of origin removed; the Fc has been removed to better emphasize *; a different adult is shown in (e)–(f) with the BF removed (e), and VL resected (f). (g) A third adult is shown, in an advance stage of dissection, emphasizing *, which may be an accessory head of the Fc. Sm, semimembranosus; St, semitendinosus.
Figure 2
Figure 2
Comparison of hind limb muscle mass distribution among segments (excluding intrinsic foot muscles) in three species of primates at adult age. Data for M. murinus from Atzeva et al. [1].
Figure 3
Figure 3
Distribution of hind limb musculature in three species of primates at adult age. Percentage mass of functional groups is indicated (i.e., hamstring mm included with hip extensors). Graphs based on mean muscle mass presented in Table 1; data for M. murinus from Atzeva et al. [1].
Figure 4
Figure 4
Distribution of hind limb musculature in three species of primates at adult age. Percentage mass in limb segments is indicated (i.e., hamstring mm excluded from hip extensors). Data for M. murinus from Atzeva et al. [1].
Figure 5
Figure 5
Comparison of hind limb muscle mass distribution among segments (excluding intrinsic foot muscles) in three species of primates: age comparisons. For this graph, iliopsoas m. and external hip rotators are excluded because they were not measured in all perinatal samples. Data for M. murinus from Atzeva et al. [1].
Figure 6
Figure 6
Comparison of hind limb muscle mass distribution among segments (excluding intrinsic foot muscles) in C. medius and G. moholi: age comparisons. For this graph, iliopsoas m. mass is included in the hip. Hip percentage in infant C. medius should be regarded with caution, since the iliopsoas muscle could only be weighed in one specimen.
Figure 7
Figure 7
Articular cartilage in adult cheirogaleids, acetabular (A) and femoral (F) surfaces are shown. Superior aspect is at the top of the image. Arrowheads indicate the junction of the subchondral plate and articular cartilage. (a, b) C. medius (same specimen); (c) M. murinus (2 different specimens). Note the difference in articular cartilage thickness of the acetabulum compared to the femoral head in C. medius (a, b). This is most apparent when viewing the extent of cartilage that is between the tidemark (TM) and the joint cavity (the TM is the line separating the deeper mineralized cartilage matrix from the more superficial matrix.) There is less disparity in articular cartilage thickness between the joint surfaces in M. murinus (c). Ca: joint cavity; Sy: synovial membrane. Stains: a, b: Gomori trichrome preparation; c: Picro Ponceau. Scale bars: a, c, d: 300 μm; b: 200 μm.
Figure 8
Figure 8
Articular cartilage in adult G. moholi. Superior aspect is at the top of the image, except in (c) (superior is to the left). Arrowheads indicate the junction of the subchondral plate and articular cartilage. (a) The proportionally thick articular cartilage of the acetabulum (A) is shown; (b, c) show a different specimen; (b, d) revealing proportionally thick articular cartilage over the acetabulum and femur (F). Ca: joint cavity; Isch: ischium; Sy: synovial membrane. Stains: a, hematoxylin eosin; b, c: Gomori trichrome preparation. Scale bars: a, b: 300 μm; c: 200 μm; TM: tidemark.
Figure 9
Figure 9
Ossification center in 2 perinatal cheirogaleids. Superior aspect is at the top of the image. C. medius (a) and M. murinus (b, c) are shown. The proximal epiphysis of the femur (F) and the iliac (Ili) and pubic (P) centers of ossification are at least partially cartilaginous. Ca: joint cavity; LT: ligamentum teres; Sy: synovial membrane. Stains: a, b, hematoxylin eosin; c: Gomori trichrome preparation. Scale bars: a, b: 200 μm; c: 300 μm.
Figure 10
Figure 10
Ossification center in 2 perinatal galagids. Superior aspect is at the top of the image. G. moholi (a)–(c) and G. demidoff (d, e) are shown. Note similar extent of ossification of the femur (F) and portions of the os coxa compared to cheirogaleids (Figure 9). Stains: hematoxylin eosin. Ca: joint cavity. Scale bars, 300 μm; Ili: ilium; A: acetabular joint space.

References

    1. Atzeva M, Demes B, Kirkbride ML, Burrows AM, Smith TD. Comparison of hind limb muscle mass in neonate and adult prosimian primates. Journal of Human Evolution. 2007;52(3):231–242. - PubMed
    1. Anemone RL. The VCL hypothesis revisited: patterns of femoral morphology among quadrupedal and saltatorial prosimian primates. The American Journal of Physical Anthropology. 1990;83(3):373–393. - PubMed
    1. Anapol F, Barry K. Fiber architecture of the extensors of the hindlimb in semiterrestrial and arboreal guenons. The American Journal of Physical Anthropology. 1996;99(3):429–447. - PubMed
    1. Demes B, Fleagle JG, Lemelin P. Myological correlates of prosimian leaping. Journal of Human Evolution. 1998;34(4):385–399. - PubMed
    1. Anemone RL. The functional anatomy of the hip and thigh in primates. In: Gebo DL, editor. Postcranial Adaptation in Nonhuman Primates. DeKalb, Ill, USA: Northern Illinois University Press; 1993. pp. 151–174.

LinkOut - more resources