. 2012 May 1;3(5):863-77.
doi: 10.1364/BOE.3.000863. Epub 2012 Apr 5.

Chaos in ocular aberration dynamics of the human eye

Affiliations

Chaos in ocular aberration dynamics of the human eye

Karen M Hampson et al. Biomed Opt Express. .

Abstract

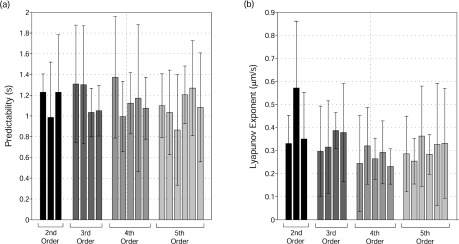
Since the characterization of the eye's monochromatic aberration fluctuations in 2001, the power spectrum has remained the most widely used method for analyzing their dynamics. However, the power spectrum does not capture the complexities of the fluctuations. We measured the monochromatic aberration dynamics of six subjects using a Shack-Hartmann sensor sampling at 21 Hz. We characterized the dynamics using techniques from chaos theory. We found that the attractor embedding dimension for all aberrations, for all subjects, was equal to three. The embedding lag averaged across aberrations and subjects was 0.31 ± 0.07 s. The Lyapunov exponent of the rms wavefront error was positive for each subject, with an average value of 0.44 ± 0.15 µm/s. This indicates that the aberration dynamics are chaotic. Implications for future modeling are discussed.

Keywords: (330.4875) Optics of physiological systems; (330.7326) Visual optics, modeling.


Figures

Fig. 1
Fig. 1
Example of a chaotic time series. The generating equation is the so-called logistic equation: xt + 1 = kxt(1-xt), which describes the relative size of a population over time, t. In the graphs the growth rate, k, is 3.8. A change in the initial relative population, xt, by only 0.1% results in a divergence of the plots.
Fig. 2
Fig. 2
Shack-Hartmann sensor for measurement of the eye’s aberrations.
Fig. 3
Fig. 3
(a) Schematic of the phase space plot for the logistic equation in Fig. 1. The divergence of neighboring trajectories is also shown. (b) A schematic of the change in the separation of neighboring trajectories versus time for such a chaotic time series.
Fig. 4
Fig. 4
Principle of the false nearest neighbors method to determine the embedding dimension. The correct embedding dimension in the illustration is 2. A point and its neighbor are separated by a distance RTrue. (a) Data points are incorrectly embedded in one-dimensional phase space. The points appear to be closer to each other than they actually are (RMeas< RTrue), and therefore the nearest neighbor is false. (b) Data points are correctly embedded in two-dimensional phase space and the true distance is determined. (c) Data points embedded in a higher dimension. Again the measured distance is equal to the true distance.
Fig. 5
Fig. 5
The mutual information averaged across Zernike coefficients for each subject. The lag is in units of data points. * Indicates the location of the first minimum, and hence the embedding lag.
Fig. 6
Fig. 6
Graph of the percentage of FNN averaged across all Zernike coefficients for each subject. * Indicates the embedding dimension, which was taken as the point where the lag was ≤5%.
Fig. 7
Fig. 7
Reconstructed attractors for the rms wavefront error for each subject. Units are in µm.
Fig. 8
Fig. 8
Average divergence of neighboring trajectories for the rms wavefront error for each subject. The linear-rise region, limit of predictability (dotted line), and divergence of random-shuffle surrogate data, are also shown. The random-shuffle data has been displaced by +1 µm/s for each subject for clarity.
Fig. 9
Fig. 9
(a) The limit of predictability for each individual Zernike aberration coefficient averaged across subjects. (b) Corresponding Lyapunov exponents. The lags used in the phase space reconstruction for each subject were obtained from Fig. 5, the minimum of the average mutual information. Error bars show ± S.D.
Fig. 10
Fig. 10
(a) Time course of the rms wavefront error for subject EM with and without a scleral lens. Both signals have been detrended and the plot for the no lens case has been displaced by an amount of +0.15 µm for clarity. (b) Corresponding divergence plots. Again the no lens case has been displaced for clarity (+0.55 µm/s).
Fig. 11
Fig. 11
(a) Time course of the rms wavefront error for subject YP and an artificial eye. Both signals have been shifted to 0 µm for comparison purposes. (b) Corresponding divergence plots. The artificial eye data has been shifted by +3.1 µm/s for clarity.
Fig. 12
Fig. 12
(a) Time course of the rms wavefront error for subject KH assuming a static pupil and the pupil shifted by plus and minus 40 µm. (b) Corresponding divergence plots. Plots have been displaced for clarity. The +40 µm and −40 µm results have been shifted by a value of −0.8 µm/s and −1.5 µm/s respectively.

References

    1. Hofer H., Artal P., Singer B., Aragón J. L., Williams D. R., “J. L. Aragόn, and D. R. Williams, “Dynamics of the eye’s wave aberration,” J. Opt. Soc. Am. A 18(3), 497–506 (2001).10.1364/JOSAA.18.000497 - DOI - PubMed
    1. Diaz-Santana L., Torti C., Munro I., Gasson P., Dainty C., “Benefit of higher closed-loop bandwidths in ocular adaptive optics,” Opt. Express 11(20), 2597–2605 (2003).10.1364/OE.11.002597 - DOI - PubMed
    1. Nirmaier T., Pudasaini G., Bille J., “Very fast wave-front measurements at the human eye with a custom CMOS-based Hartmann-Shack sensor,” Opt. Express 11(21), 2704–2716 (2003).10.1364/OE.11.002704 - DOI - PubMed
    1. Hampson K. M., Munro I., Paterson C., Dainty C., “Weak correlation between the aberration dynamics of the human eye and the cardiopulmonary system,” J. Opt. Soc. Am. A 22(7), 1241–1250 (2005).10.1364/JOSAA.22.001241 - DOI - PubMed
    1. Chin S. S., Hampson K. M., Mallen E. A. H., “Binocular correlation of ocular aberration dynamics,” Opt. Express 16(19), 14731–14745 (2008).10.1364/OE.16.014731 - DOI - PubMed

LinkOut - more resources