. 2012 May 1;3(5):878-98.
doi: 10.1364/BOE.3.000878. Epub 2012 Apr 6.

Improving optical contact for functional near‑infrared brain spectroscopy and imaging with brush optodes

Improving optical contact for functional near‑infrared brain spectroscopy and imaging with brush optodes

Bilal Khan et al. Biomed Opt Express. .

Abstract

A novel brush optode was designed and demonstrated to overcome poor optical contact with the scalp that can occur during functional near infrared spectroscopy (fNIRS) and imaging due to light obstruction by hair. The brush optodes were implemented as an attachment to existing commercial flat-faced (conventional) fiber bundle optodes. The goal was that the brush optodes would thread through hair and improve optical contact on subjects with dense hair. Simulations and experiments were performed to assess the magnitude of these improvements. FNIRS measurements on 17 subjects with varying hair colors (blonde, brown, and black) and hair densities (0-2.96 hairs/mm(2)) were performed during a finger tapping protocol for both flat and brush optodes. In addition to reaching a study success rate of almost 100% when using the brush optode extensions, the measurement setup times were reduced by a factor of three. Furthermore, the brush optodes enabled improvements in the activation signal-to-noise ratio (SNR) by up to a factor of ten as well as significant (p < 0.05) increases in the detected area of activation (dAoA). The measured improvements in SNR were matched by Monte Carlo (MC) simulations of photon propagation through scalp and hair. In addition, an analytical model was derived to mathematically estimate the observed light power losses due to different hair colors and hair densities. Interestingly, the derived analytical formula produced excellent estimates of the experimental data and MC simulation results despite several simplifying assumptions. The analytical model enables researchers to readily estimate the light power losses due to obstruction by hair for both flat-faced fiber bundles and individual fibers for a given subject.

Keywords: (170.2655) Functional monitoring and imaging; (170.3880) Medical and biological imaging; (300.6340) Spectroscopy, infrared.


Figures

Fig. 1
Fig. 1
Pictures of the brush-fiber optode showing (a) the brush-fiber end to be placed on an individual’s head, (b) how the brush optode fibers could thread through hair to attain improved optical contact, and (c) the distal end of the brush optode that was designed to attach onto the commercial system’s flat-ended fiber bundles.
Fig. 2
Fig. 2
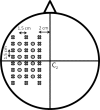
Probe configuration setup on a human subject. The Cz position according to the EEG International 10/20 system and its relation to the location of the probe configuration is shown. The filled ‘X’ symbols identify the locations of detectors, and the filled circles identify the locations of sources.
Fig. 3
Fig. 3
Schematics of (a) the overall MC simulation setup, and (b) a zoomed-in view of the hair layers, hair follicles, and the placement of a couple of brush fibers among the 64 brush fibers used in the simulations. In (a), the red solid lines are the simulated rays inside the scalp tissue (10 x 10 x 4 mm3), becoming red dashed lines once they left the scalp tissue. In (b), the short light blue cylinder indicates a brush fiber blocked by hair, and the long light blue cylinder a brush fiber that had good optical contact with the scalp.
Fig. 4
Fig. 4
A comparison of ΔHbO and ΔHb (a) SNR, (b) CBR, and (c) dAoA between flat and brush optode sets. The single (p<0.05), double (p < 0.005), and triple (p < 0.0005) asterisks identify the significance in activation metric mean difference between the flat and brush optode measurements.
Fig. 5
Fig. 5
(a) A scatter plot comparing the activation SNR (dB) of the flat optodes (x-axis) versus that of the brush-fiber optodes (y-axis). The blue circles (short hair subjects) and red circles (long hair subjects) are SNR data points, the red-dashed line indicates the line of equality between the two SNRs, and the red-solid line shows a linear fit through the data. ∆HbO averaged time-plots are shown for (b) a bald subject (0 hairs/mm2) and (c) a subject with 2.8 hairs/mm2.
Fig. 6
Fig. 6
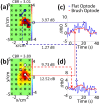
ΔHbO activation images (µMolar scale) for the same subject (black hair at a density of 2.2 hairs/mm2) using (a) the flat optodes and (b) the brush optodes. The sources (grey filled circles) and detectors (grey filled Xs) are used to show the source and detector locations. (c) In regions where activation could be detected by both the flat and brush optodes, the latter resulted in significantly higher SNR (shown in dB). There were also locations where the flat optodes detected no significant activation where the brush optodes did (d).
Fig. 7
Fig. 7
ΔHbO activation images, with color scales in µMolar, for four individual subjects with similar hair densities (~2.8 hairs/mm2) and hair lengths (20–23 mm), but different hair colors. Source positions are identified by the grey filled circles and the detector positions by the grey filled Xs.
Fig. 8
Fig. 8
Scatter plots comparing the ΔHbO trend in (a) SNR, (b) CBR, and (c) dAoA for all short hair subjects (n = 13) for both the flat optodes () and brush optodes (X). Similar plots were made for long hair subjects (n = 4) (d)-(f). The single (p<0.05), double (p < 0.005), and triple (p < 0.0005) asterisks identify the significance in activation metric mean difference between the flat and brush optode measurements.
Fig. 9
Fig. 9
ΔHbO activation images (color scales in µMolar) for four individual subjects with similar hair color (black), but different hair densities for both flat and brush optode sets. Source positions are identified by the grey filled circles and the detector positions by the grey filled Xs.
Fig. 10
Fig. 10
Scatter plot comparing the ΔHbO trend in (a) SNR, (b) CBR, and (c) dAoA for short hair subjects of all hair colors (n = 13) for both the flat optodes (∆) and brush optodes (X). The single (p<0.05), double (p < 0.005), and triple (p < 0.0005) asterisks identify the significance in activation metric mean difference between the flat and brush optode measurements.
Fig. 11
Fig. 11
The percent power loss with respect to bald subjects when using either the flat or the brush optodes. Comparison of the experimental (Exp), MC simulated (MC), and analytical formula (AF) results is performed across hair densities for each hair color.

Similar articles

Cited by

References

    1. Bai X., Liu Z., Zhang N., Chen W., He B., “Three-dimensional source imaging from simultaneously recorded ERP and BOLD-fMRI,” IEEE Trans. Neural Syst. Rehabil. Eng. 17(2), 101–106 (2009).10.1109/TNSRE.2009.2015196 - DOI - PMC - PubMed
    1. Li K., Guo L., Nie J., Li G., Liu T., “Review of methods for functional brain connectivity detection using fMRI,” Comput. Med. Imaging Graph. 33(2), 131–139 (2009).10.1016/j.compmedimag.2008.10.011 - DOI - PMC - PubMed
    1. Muehllehner G., Karp J. S., “Positron emission tomography,” Phys. Med. Biol. 51(13), R117–R137 (2006).10.1088/0031-9155/51/13/R08 - DOI - PubMed
    1. Dilharreguy B., Jones R. A., Moonen C. T., “Influence of fMRI data sampling on the temporal characterization of the hemodynamic response,” Neuroimage 19(4), 1820–1828 (2003).10.1016/S1053-8119(03)00289-1 - DOI - PubMed
    1. Huppert T. J., Hoge R. D., Diamond S. G., Franceschini M. A., Boas D. A., “A temporal comparison of BOLD, ASL, and NIRS hemodynamic responses to motor stimuli in adult humans,” Neuroimage 29(2), 368–382 (2006).10.1016/j.neuroimage.2005.08.065 - DOI - PMC - PubMed

LinkOut - more resources