Speckle variance optical coherence tomography of the rodent spinal cord: in vivo feasibility
- PMID: 22567584
- PMCID: PMC3342196
- DOI: 10.1364/BOE.3.000911
Speckle variance optical coherence tomography of the rodent spinal cord: in vivo feasibility
Abstract
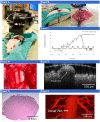
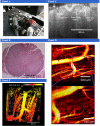
Optical coherence tomography (OCT) has the combined advantage of high temporal (µsec) and spatial (<10µm) resolution. These features make it an attractive tool to study the dynamic relationship between neural activity and the surrounding blood vessels in the spinal cord, a topic that is poorly understood. Here we present work that aims to optimize an in vivo OCT imaging model of the rodent spinal cord. In this study we image the microvascular networks of both rats and mice using speckle variance OCT. This is the first report of depth resolved imaging of the in vivo spinal cord using an entirely endogenous contrast mechanism.
Keywords: (110.4500) Optical coherence tomography; (170.2655) Functional monitoring and imaging; (170.3880) Medical and biological imaging.
Figures


Similar articles
-
Growing Trend to Adopt Speckle Variance Optical Coherence Tomography for Biological Tissue Assessments in Pre-Clinical Applications.Micromachines (Basel). 2024 Apr 25;15(5):564. doi: 10.3390/mi15050564. Micromachines (Basel). 2024. PMID: 38793137 Free PMC article. Review.
-
Photothermal modulation speckle optical coherence tomography of microvascular nondestructive imaging in vivo with high effective resolution.Opt Lett. 2023 Apr 1;48(7):1878-1881. doi: 10.1364/OL.486272. Opt Lett. 2023. PMID: 37221789
-
Improved speckle contrast optical coherence tomography angiography.Am J Transl Res. 2018 Oct 15;10(10):3025-3035. eCollection 2018. Am J Transl Res. 2018. PMID: 30416648 Free PMC article.
-
Ex vivo visualization of human ciliated epithelium and quantitative analysis of induced flow dynamics by using optical coherence tomography.Lasers Surg Med. 2017 Mar;49(3):270-279. doi: 10.1002/lsm.22653. Epub 2017 Feb 23. Lasers Surg Med. 2017. PMID: 28231402 Free PMC article.
-
Review of speckle and phase variance optical coherence tomography to visualize microvascular networks.J Biomed Opt. 2013 May;18(5):50901. doi: 10.1117/1.JBO.18.5.050901. J Biomed Opt. 2013. PMID: 23616094 Review.
Cited by
-
Comparative study of optical coherence tomography angiography algorithms for rodent retinal imaging.Exp Biol Med (Maywood). 2021 Oct;246(20):2207-2213. doi: 10.1177/15353702211024572. Epub 2021 Jun 12. Exp Biol Med (Maywood). 2021. PMID: 34120494 Free PMC article.
-
Quantitative analysis of vascular changes during photoimmunotherapy using speckle variance optical coherence tomography (SV-OCT).Biomed Opt Express. 2021 Mar 2;12(4):1804-1820. doi: 10.1364/BOE.419163. eCollection 2021 Apr 1. Biomed Opt Express. 2021. PMID: 33996199 Free PMC article.
-
Perspectives on endoscopic functional photoacoustic microscopy.Appl Phys Lett. 2024 Jul 15;125(3):030502. doi: 10.1063/5.0201691. Appl Phys Lett. 2024. PMID: 39022117 Free PMC article.
-
Electrophysiological and Anatomical Correlates of Spinal Cord Optical Coherence Tomography.PLoS One. 2016 Apr 6;11(4):e0152539. doi: 10.1371/journal.pone.0152539. eCollection 2016. PLoS One. 2016. PMID: 27050096 Free PMC article.
-
Microvascular imaging of the skin.Phys Med Biol. 2019 Mar 21;64(7):07TR01. doi: 10.1088/1361-6560/ab03f1. Phys Med Biol. 2019. PMID: 30708364 Free PMC article. Review.
References
-
- Fetcho J. R., O’Malley D. M., “Visualization of active neural circuitry in the spinal cord of intact zebrafish,” J. Neurophysiol. 73(1), 399–406 (1995). - PubMed
LinkOut - more resources
Full Text Sources
