

Using multiple imputation to assign pesticide use for non-responders in the follow-up questionnaire in the Agricultural Health Study
- PMID: 22569205
- PMCID: PMC3396426
- DOI: 10.1038/jes.2012.31
Using multiple imputation to assign pesticide use for non-responders in the follow-up questionnaire in the Agricultural Health Study
Abstract
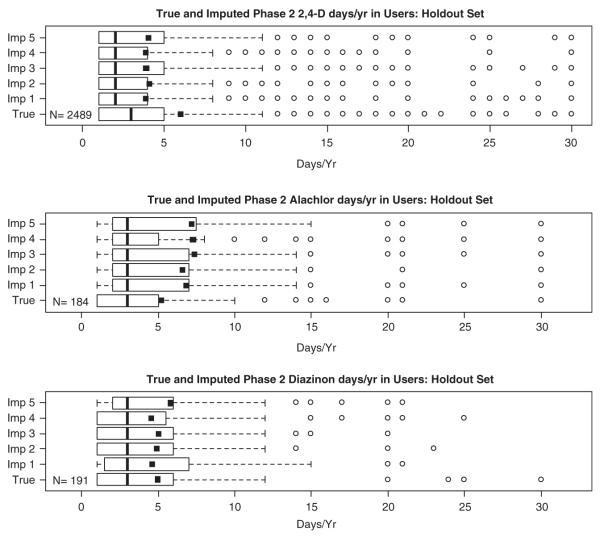
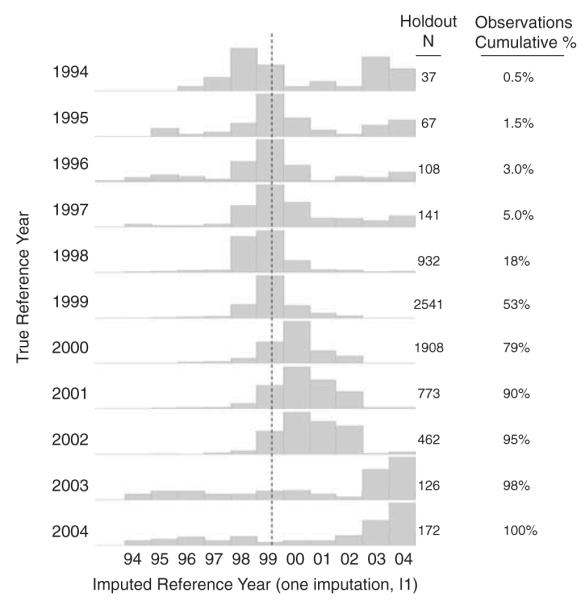
The Agricultural Health Study (AHS), a large prospective cohort, was designed to elucidate associations between pesticide use and other agricultural exposures and health outcomes. The cohort includes 57,310 pesticide applicators who were enrolled between 1993 and 1997 in Iowa and North Carolina. A follow-up questionnaire administered 5 years later was completed by 36,342 (63%) of the original participants. Missing pesticide use information from participants who did not complete the second questionnaire impedes both long-term pesticide exposure estimation and statistical inference of risk for health outcomes. Logistic regression and stratified sampling were used to impute key variables related to the use of specific pesticides for 20,968 applicators who did not complete the second questionnaire. To assess the imputation procedure, a 20% random sample of participants was withheld for comparison. The observed and imputed prevalence of any pesticide use in the holdout dataset were 85.7% and 85.3%, respectively. The distribution of prevalence and days/year of use for specific pesticides were similar across observed and imputed in the holdout sample. When appropriately implemented, multiple imputation can reduce bias and increase precision and can be more valid than other missing data approaches.
Figures
References
-
- Rubin DB. Multiple Imputation of Nonresponse in Surveys. J.Wiley and Sons; New York, NY: 1987.
-
- Schafer JL, Ezzatti-Rice TM, Johnson W, Khare M, Little RJA, Rubin DB. The NHANES III multiple imputation project. Proc Survey Res Methods Section Am Stat Assoc. 1996:28–37.
-
- Mislevy RJ, Johnson EG, Muraki E. Scaling procedures in NAEP. J Educational Stat. 1992;17:131–154.
Publication types
MeSH terms
Substances
Grants and funding
LinkOut - more resources
Full Text Sources
Medical
