. 2012 May 8:3:818.
doi: 10.1038/ncomms1826.

Hydroxylation of 5-methylcytosine by TET2 maintains the active state of the mammalian HOXA cluster

Affiliations

Hydroxylation of 5-methylcytosine by TET2 maintains the active state of the mammalian HOXA cluster

Michael T Bocker et al. Nat Commun. .

Abstract

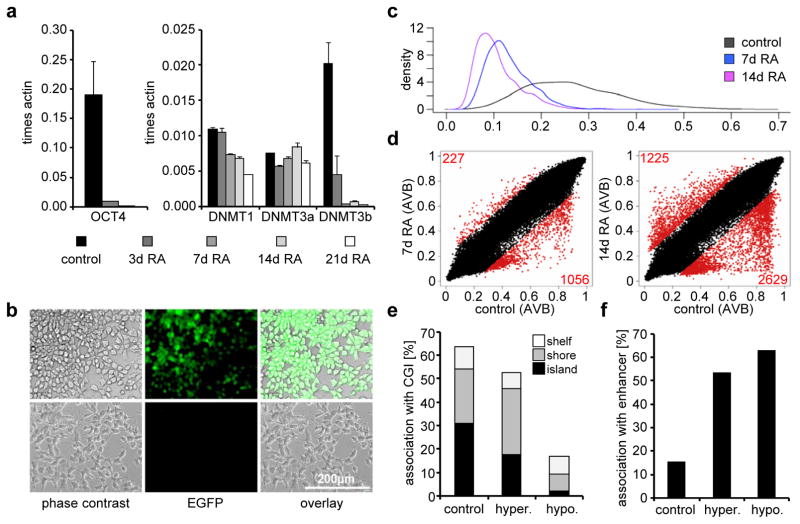
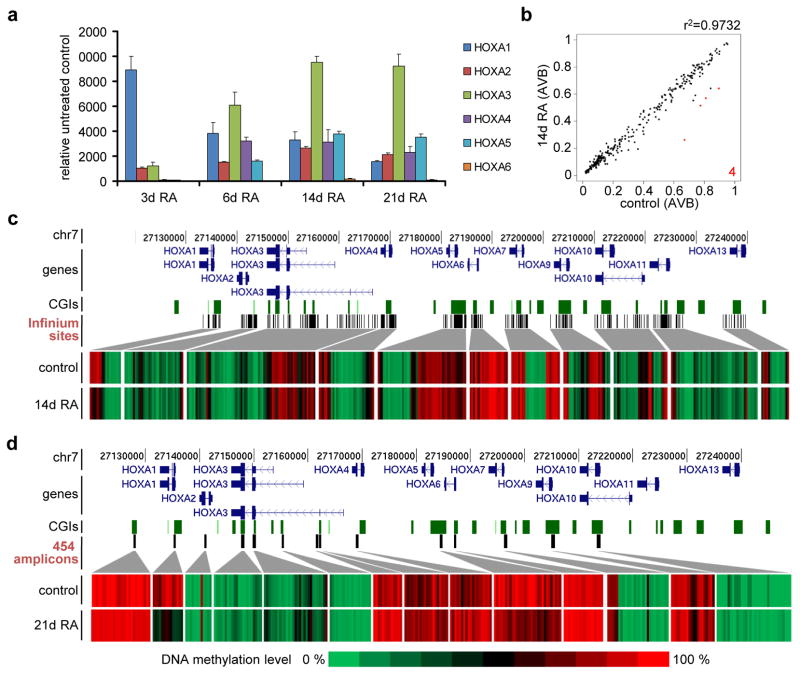
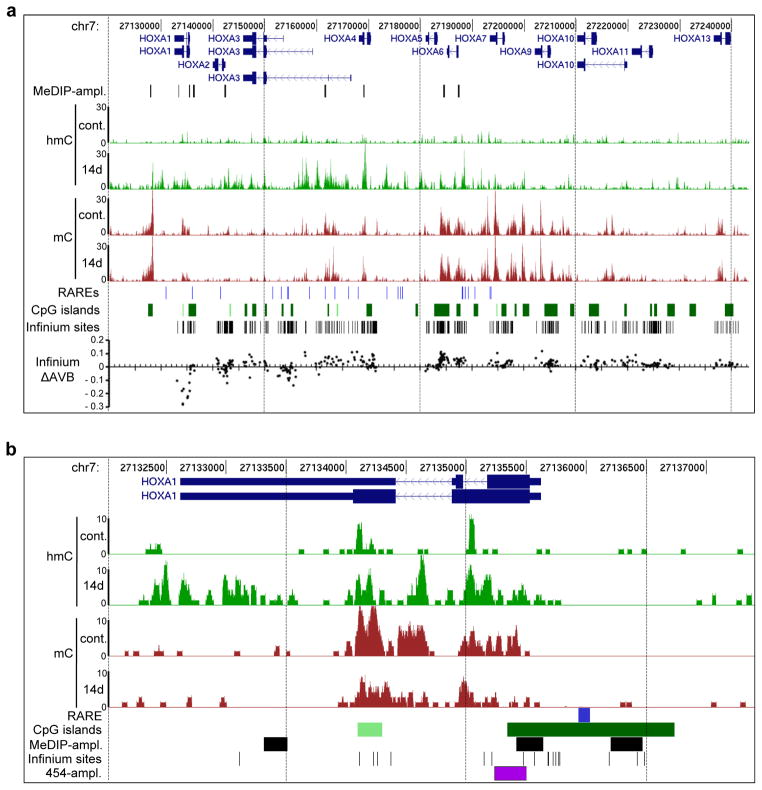
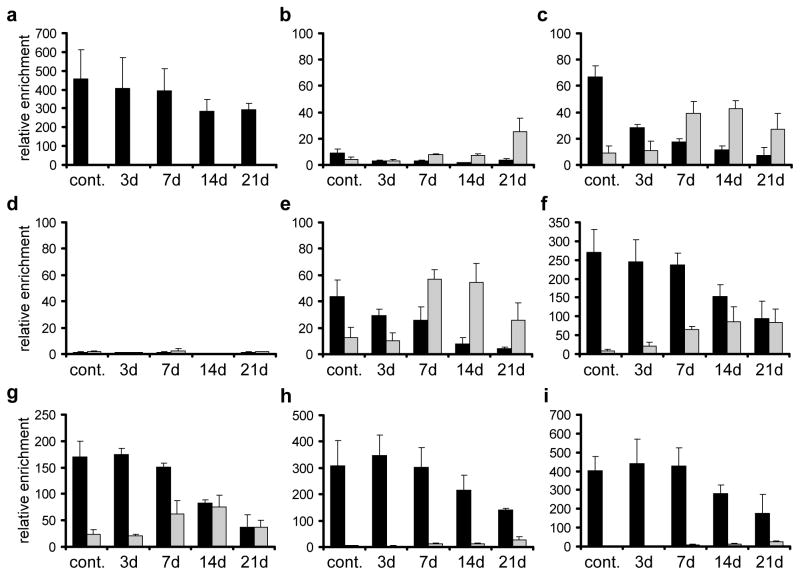
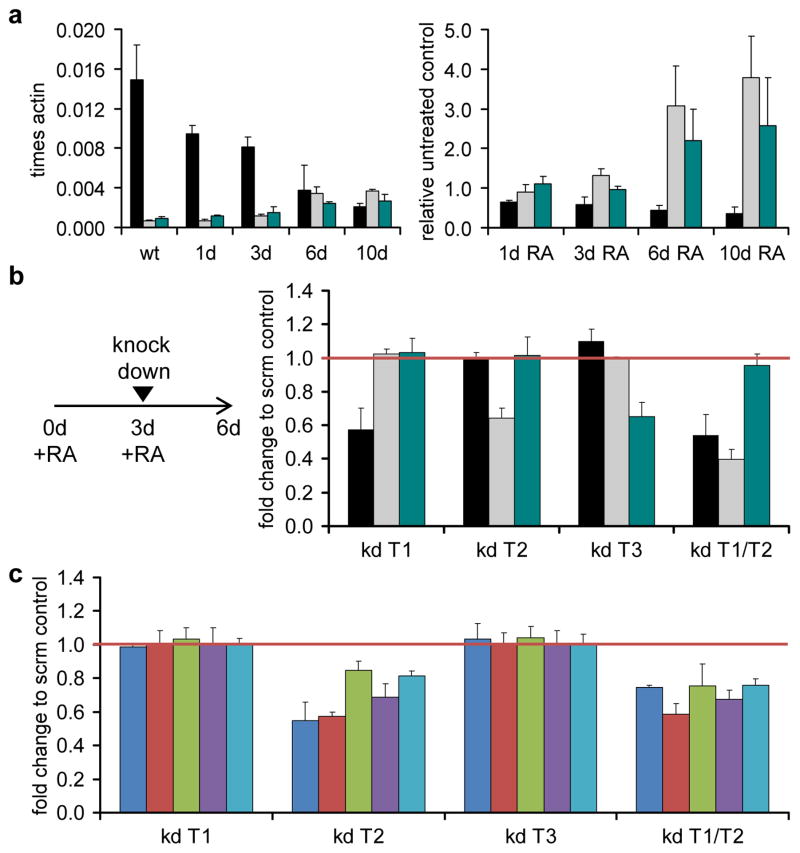
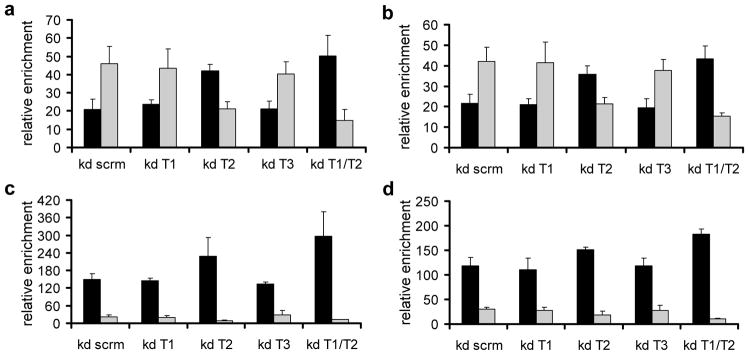
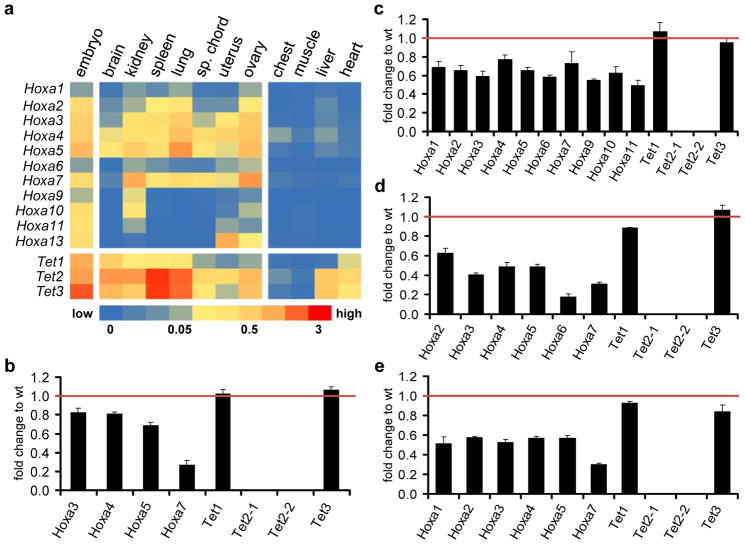
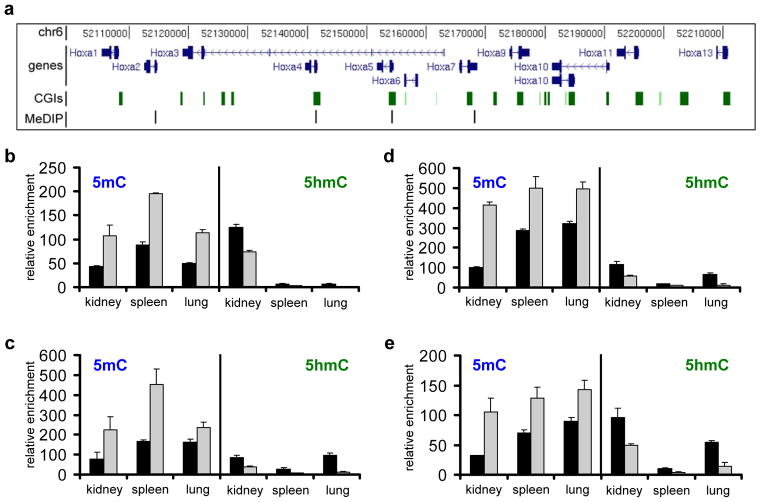
Differentiation is accompanied by extensive epigenomic reprogramming, leading to the repression of stemness factors and the transcriptional maintenance of activated lineage-specific genes. Here we use the mammalian Hoxa cluster of developmental genes as a model system to follow changes in DNA modification patterns during retinoic acid-induced differentiation. We find the inactive cluster to be marked by defined patterns of 5-methylcytosine (5mC). Upon the induction of differentiation, the active anterior part of the cluster becomes increasingly enriched in 5-hydroxymethylcytosine (5hmC), following closely the colinear activation pattern of the gene array, which is paralleled by the reduction of 5mC. Depletion of the 5hmC generating dioxygenase Tet2 impairs the maintenance of Hoxa activity and partially restores 5mC levels. Our results indicate that gene-specific 5mC-5hmC conversion by Tet2 is crucial for the maintenance of active chromatin states at lineage-specific loci.


Conflict of interest statement

Conflict of interest

The authors declare that they have no conflict of interest.

Figures

Figure 1
Figure 1. Pluripotency features and DNA methylation profiles of NT2 cells upon retinoic acid induction
(a) Expression of OCT4, DNMT1, DNMT3a and DNMT3b in untreated NT2 cells and cells treated for 3, 7, 14 and 21 days with retinoic acid (RA). qRT-PCR measurements with at least three biological replicates were internally normalised to the corresponding β-actin expression levels. Standard deviations are indicated by error bars. (b) Microscopic images of NT2 cells showing the expression of EGFP under the control of the OCT4-promoter (first row) and the same cells after treatment with retinoic acid for 7 days (second row). The first column shows the light microscopic images (phase contrast), the second column EGFP fluorescence, the third column an overlay. (c) Density plot showing the distribution of the AVB-values (x-axis) of 3091 non-CpG methylation states interrogated by the Infinium450K BeadChip, measured in uninduced NT2 cells (black, mean = 0.27) and cells treated for 7 days (blue, mean = 0.13) and 14 days (purple, mean = 0.11) with RA. (d) Scatter plots showing the comparison of Illumina DNA methylation profiles (including non-CpG sites) of untreated NT2 cells with profiles of cells treated for 7 days (left plot) and 14 days (right plot) with RA. Red dots and numbers indicate differentially methylated sites. (e) Bar diagram showing the association of all sites interrogated by the Infinium450K BeadChip (control), RA-induced hypomethylated sites (hypo.) and hypermethylated sites (hyper.) with CpG islands, shelf and shore regions. (f) Bar diagram showing the correlation of RA-induced differentially methylated sites (hypo- or hypermethylated compared to controls) identified using the Infinium450K BeadChip with annotated enhancer regions.
Figure 2
Figure 2. Epigenetic regulation of the HOXA cluster
(a) qRT-PCR expression analysis of HOXA genes (1 to 6) after RA treatment for 3, 6, 14 and 21 days. qPCR values were internally normalised to the corresponding lamin-b and β-actin expression levels. Expression values indicate fold induction compared to the non-treated control. All treatments and measurements were repeated three times. Standard deviations are indicated by error bars. (b) Scatter plot showing the comparison of Illumina DNA methylation values of sites located within the HOXA cluster of NT2 cells treated for 14 days with RA with those of untreated cells. Red dots indicate differentially methylated sites. Only four sites were significantly hypomethylated upon RA treatment, corresponding to the HOXA1 gene body. (c) Array-predicted DNA methylation levels in the HOXA cluster in untreated NT2 cells (control) and cells treated for 14 days with retinoic acid (14d RA). HOXA transcription units on chromosome 7 are indicated in dark blue, CpG islands as green squares and interrogated Infinium sites as black bars. Genomic features are viewed as custom tracks in the UCSC genome browser. (d) DNA methylation levels in the HOXA cluster, as obtained by 454 bisulfite sequencing of selected amplicons (black bars) in untreated NT2 cells (control) and in cells treated for 21 days with retinoic acid (21d RA). HOXA transcription units on chromosome 7 (in dark blue), CGIs (green bars) and 454 amplicons (black bars) are indicated. Genomic features are viewed as custom tracks in the UCSC genome browser.
Figure 3
Figure 3. Distribution of 5mC and 5hmC within the HOXA cluster
(a) hMeDIP-seq (hmC) and MeDIP-seq (mC) profiles of the HOXA cluster in untreated NT2 cells (cont.) and cells treated for 14 days with retinoic acid (14d). Enrichments are indicated as increase in the sequence coverage. HOXA transcription units on chromosome 7 are indicated on top in dark blue, below (h)MeDIP-amplicons are indicated as black lines. Potential retinoic acid response elements (RAREs) are shown as light blue lines below the profiles, CpG islands as green squares and sites interrogated by the Infinium450K BeadChip as black bars. At the bottom the difference of methylation values of the Infinium analysis (ΔAVB) between untreated and NT2 cells treated for 14 days with RA for each Infinium site is indicated. Genomic features are viewed as custom tracks in the UCSC genome browser (b) Detailed hMeDIP-seq (hmC) and MeDIP-seq (mC) profiles at the HOXA1 locus in untreated NT2 cells (cont.) and cells treated for 14 days with retinoic acid (14d). The HOXA1 RARE (blue bar), CpG islands (green squares), (h)MeDIP-amplicons (black squares), Infinium sites (black lines) and the 454 bisulfite sequencing amplicon (purple square) are indicated below the profiles. Genomic features are viewed as custom tracks in the UCSC genome browser.
Figure 4
Figure 4. Levels of 5mC and 5hmC at selected regions of the HOXA cluster
Genomic DNA from untreated NT2 cells and cells treated for 3, 7, 14 and 21 days with retinoic acid was analysed by (h)MeDIP using antibodies against 5mC and 5hmC. Immunoprecipitated DNA was amplified by gene specific qPCR. The following regions were analysed: (a) HOXA1 downstream CpG island, (b) HOXA1 second exon (covering a potential NANOG/OCT4 binding site), (c) HOXA1 promoter/1st exon, (d) HOXA1 upstream RARE (e) HOXA2 promoter/1st exon (f) HOXA3 2nd CpG island (g) HOXA4 2nd exon (h) HOXA5–6 intergenic CpG island (i) HOXA6 promoter/1st exon. Enrichments were calculated relative to the unmethylated UEB2 control. 5mC values are shown as black bars, 5hmC values as grey bars. Diagrams show the results of at least three independent experiments. Standard deviations are indicated by error bars.
Figure 5
Figure 5. TET2 is necessary for the maintenance of HOXA activity
(a) qRT-PCR expression analysis of the three TET genes after RA treatment for 1, 3, 6 and 10 days. The left panel shows the expression levels of TET1 (black bars), TET2 (grey bars) and TET3 (green bars) as a fraction of the β-actin expression levels. The right panel shows the expression changes of the three TET mRNAs during RA treatment relative to the untreated control, internally normalised to the corresponding expression levels of lamin-b and β-actin. (b) qRT-PCR expression analysis of TET1 (black bars), TET2 (grey bars) and TET3 (green bars) after RA treatment and successive depletion with specific siRNA pools in single knock downs (kd T1, kd T2, kd T3) or in a TET1/TET2 double knock down (kd T1/T2). NT2 cells were treated for 3 days with retinoic acid, replated and transfected with siRNAs. After 3 more days cells were harvested and total RNA for qRT-PCR analysis was isolated. Y-axis values indicate fold change compared to the scrambled knock down control (non-targeting pool). qPCR values were internally normalised to the corresponding lamin-b and β-actin expression levels. (c) qRT-PCR expression analysis of HOXA1 (blue bars), HOXA2 (red bars), HOXA3 (green bars) HOXA4 (purple bars), HOXA5 (light blue bars) after RA treatment and successive TET-depletion with specific siRNAs in single knock downs (kd T1, kd T2, kd T3) or in TET1/TET2 double combination (kd T1/T2). Y-axis values indicate fold change compared to the scrambled knock down control (non-targeting pool). qPCR values were internally normalised to the corresponding lamin-b and β-actin expression levels. Treatments and measurements in (a)–(c) were repeated at least three times. Standard deviations are indicated by error bars.
Figure 6
Figure 6. TET2 is mainly responsible for the 5mC-5hmC conversion in the HOXA cluster during retinoic acid induction
The diagrams show the distribution of 5mC and 5hmC at four regions of the HOXA cluster in NT2 cells transfected with control siRNAs (non-targeting pool - kd scrm), siRNA pools against TET1 (kd T1), TET2 (kd T2), TET3 (kd T3) and TET1/TET2 (kd T1/T2). NT2 cells were treated for 3 days with retinoic acid, replated and transfected with siRNAs. After 3 additional days, cells were harvested and genomic DNA for (h)MeDIP analysis with antibodies specific for 5mC and 5hmC was isolated. Immunoprecipitated DNA was amplified by gene specific qPCR. The following regions were analysed: (a) HOXA1 promoter/1st exon, (b) HOXA2 promoter/1st exon, (c) HOXA3 2nd CpG island and (d) HOXA4 2nd exon. Enrichments were calculated relative to the unmethylated UEB2 control. 5mC values are shown as black bars, 5hmC values as grey bars. Diagrams show the results of three independent experiments. Standard deviations are indicated by error bars.
Figure 7
Figure 7. Expression of Hoxa genes is reduced in mouse Tet2−/− tissues
(a) qRT-PCR expression analysis of the eleven Hoxa and three Tet genes in murine wild type tissues (indicated above the columns). The heat map shows average Hoxa and Tet expression as percentage of the internal GPDH levels. Expression patterns of both groups of genes in 13.5 days wild type embryos is shown as a positive control (most left column). Four examples of tissues with very low or absent expression are also shown (chest, muscle, liver, heart). (b)–(d) qRT-PCR expression analysis of Hoxa genes that showed significant levels in (a) and the three Tet genes in selected Tet2/ tissues. Diagrams show the expression as fold change relative to the wild type (=1). For Tet2, two different primer pairs were used. (b) brain, (c) kidney, (d) spleen, (e) lung. Standard deviations of three replicates are indicated by error bars.
Figure 8
Figure 8. Levels of 5mC and 5hmC at selected regions of the murine Hoxa cluster in control and Tet2−/− tissues
Genomic DNA was isolated from three tissues showing significant Hoxa expression in the wild type situation (kidney, spleen and lung) and used for (h)MeDIP analysis with antibodies specific for 5mC and 5hmC. (a) Diagram showing the mouse Hoxa transcription units on chromosome 6 (in dark blue), the CpG islands within the cluster (green squares) and the four (h)MeDIP-amplicons (indicated as black lines) used for the analysis. Genomic features are viewed as custom tracks in the UCSC genome browser55. The following regions were analysed: (b) mHoxa2 promoter, (c) mHoxa4 1st exon, (d) mHoxa5 1st exon and (e) mHoxa7 promoter. The diagrams show the distribution of 5mC (left in each panel) and 5hmC (right in each panel) at four regions of the mouse Hoxa cluster in three tissues (kidney, spleen, lung) in wt (black bars) and Tet2/ (grey bars). Enrichments were calculated relative to the unmethylated mGapdh and mbeta-actin controls. Standard deviations of three replicates are indicated by error bars.

References

    1. Duboule D, Morata G. Colinearity and functional hierarchy among genes of the homeotic complexes. Trends Genet. 1994;10:358–364. - PubMed
    1. Kmita M, Duboule D. Organizing axes in time and space; 25 years of colinear tinkering. Science. 2003;301:331–333. - PubMed
    1. Duester G. Retinoic acid synthesis and signaling during early organogenesis. Cell. 2008;134:921–931. - PMC - PubMed
    1. Soshnikova N, Duboule D. Epigenetic regulation of Hox gene activation: the waltz of methyls. Bioessays. 2008;30:199–202. - PubMed
    1. Bernstein BE, et al. A bivalent chromatin structure marks key developmental genes in embryonic stem cells. Cell. 2006;125:315–326. - PubMed

Publication types

Associated data