

Cell cycle arrest associated with anoxia-induced quiescence, anoxic preconditioning, and embryonic diapause in embryos of the annual killifish Austrofundulus limnaeus
- PMID: 22570106
- PMCID: PMC3448833
- DOI: 10.1007/s00360-012-0672-9
Cell cycle arrest associated with anoxia-induced quiescence, anoxic preconditioning, and embryonic diapause in embryos of the annual killifish Austrofundulus limnaeus
Abstract
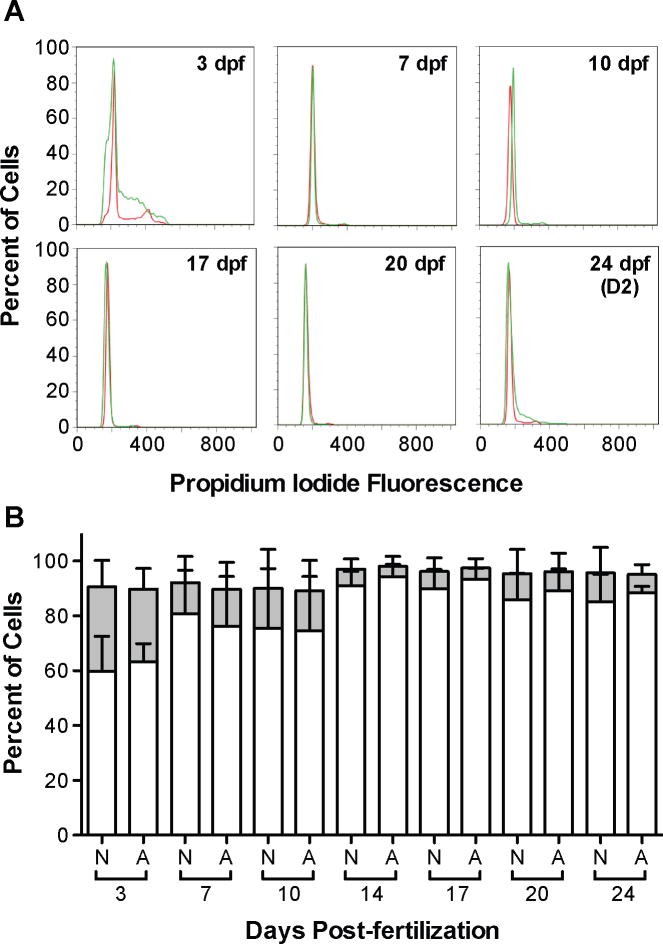
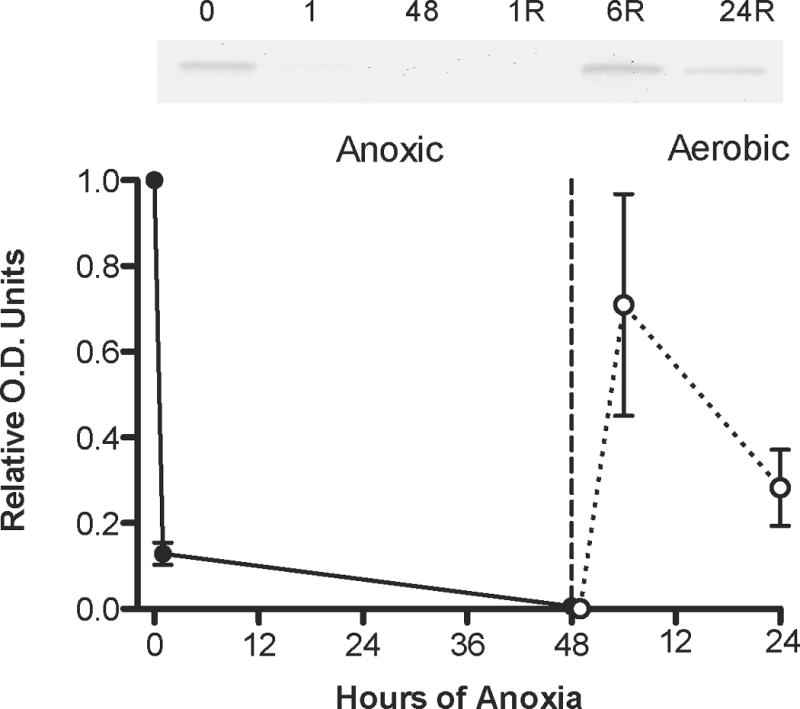
Embryos of the annual killifish Austrofundulus limnaeus can enter into dormancy associated with diapause and anoxia-induced quiescence. Dormant embryos are composed primarily of cells arrested in the G(1)/G(0) phase of the cell cycle based on flow cytometry analysis of DNA content. In fact, most cells in developing embryos contain only a diploid complement of DNA, with very few cells found in the S, G(2), or M phases of the cell cycle. Diapause II embryos appear to be in a G(0)-like state with low levels of cyclin D1 and p53. However, the active form of pAKT is high during diapause II. Exposure to anoxia causes an increase in cyclin D1 and p53 expression in diapause II embryos, suggesting a possible re-entry into the cell cycle. Post-diapause II embryos exposed to anoxia or anoxic preconditioning have stable levels of cyclin D1 and stable or reduced levels of p53. The amount of pAKT is severely reduced in 12 dpd embryos exposed to anoxia or anoxic preconditioning. This study is the first to evaluate cell cycle control in embryos of A. limnaeus during embryonic diapause and in response to anoxia and builds a foundation for future research on the role of cell cycle arrest in supporting vertebrate dormancy.
Figures


Similar articles
-
Cell cycle regulation during development and dormancy in embryos of the annual killifish Austrofundulus limnaeus.Cell Cycle. 2012 May 1;11(9):1697-704. doi: 10.4161/cc.19881. Epub 2012 May 1. Cell Cycle. 2012. PMID: 22531486 Free PMC article. Review.
-
Hypoxia and Anoxia Tolerance in the Annual Killifish Austrofundulus limnaeus.Integr Comp Biol. 2016 Oct;56(4):500-9. doi: 10.1093/icb/icw092. Epub 2016 Aug 9. Integr Comp Biol. 2016. PMID: 27507238
-
Mitochondrial physiology of diapausing and developing embryos of the annual killifish Austrofundulus limnaeus: implications for extreme anoxia tolerance.J Comp Physiol B. 2010 Oct;180(7):991-1003. doi: 10.1007/s00360-010-0478-6. Epub 2010 May 16. J Comp Physiol B. 2010. PMID: 20473761
-
Extreme anoxia tolerance in embryos of the annual killifish Austrofundulus limnaeus: insights from a metabolomics analysis.J Exp Biol. 2007 Jul;210(Pt 13):2253-66. doi: 10.1242/jeb.005116. J Exp Biol. 2007. PMID: 17575031
-
Dispersion/reaggregation in early development of annual killifishes: Phylogenetic distribution and evolutionary significance of a unique feature.Dev Biol. 2018 Oct 1;442(1):69-79. doi: 10.1016/j.ydbio.2018.07.015. Epub 2018 Jul 21. Dev Biol. 2018. PMID: 30040922 Review.
Cited by
-
Avoidance of apoptosis in embryonic cells of the annual killifish Austrofundulus limnaeus exposed to anoxia.PLoS One. 2013 Sep 18;8(9):e75837. doi: 10.1371/journal.pone.0075837. eCollection 2013. PLoS One. 2013. PMID: 24058704 Free PMC article.
-
The Power of Fish Models to Elucidate Skin Cancer Pathogenesis and Impact the Discovery of New Therapeutic Opportunities.Int J Mol Sci. 2018 Dec 7;19(12):3929. doi: 10.3390/ijms19123929. Int J Mol Sci. 2018. PMID: 30544544 Free PMC article. Review.
-
Cell cycle regulation during development and dormancy in embryos of the annual killifish Austrofundulus limnaeus.Cell Cycle. 2012 May 1;11(9):1697-704. doi: 10.4161/cc.19881. Epub 2012 May 1. Cell Cycle. 2012. PMID: 22531486 Free PMC article. Review.
-
Cell cycle dynamics during diapause entry and exit in an annual killifish revealed by FUCCI technology.Evodevo. 2019 Nov 8;10:29. doi: 10.1186/s13227-019-0142-5. eCollection 2019. Evodevo. 2019. PMID: 31728179 Free PMC article.
-
The genome of Austrofundulus limnaeus offers insights into extreme vertebrate stress tolerance and embryonic development.BMC Genomics. 2018 Feb 20;19(1):155. doi: 10.1186/s12864-018-4539-7. BMC Genomics. 2018. PMID: 29463212 Free PMC article.
References
-
- Almog N, Rotter V. Involvement of p53 in cell differentiation and development. Biochim Biophys Acta. 1997;1333:F1–F27. - PubMed
-
- Burch PM, Heintz MH. Redox regulation of cell-cycle re-entry: cyclin D1 as a primary target for the mitogenic effects of reactive oxygen and nitrogen species. Antioxid Redox Sig. 2005;7:741–751. - PubMed
-
- Chennault T, Podrabsky JE. Aerobic and anaerobic capacities differ in embryos of the annual killifish Austrofundulus limnaeus that develop on alternate developmental trajectories. J Exp Zool A. 2010;313A:587–596. - PubMed
-
- Denlinger DL. Regulation of Diapause. Annu Rev Entomol. 2002;47:93–122. - PubMed
Publication types
MeSH terms
Substances
Grants and funding
LinkOut - more resources
Full Text Sources
Research Materials
Miscellaneous
