

From molecular genetics to phylodynamics: evolutionary relevance of mutation rates across viruses
- PMID: 22570614
- PMCID: PMC3342999
- DOI: 10.1371/journal.ppat.1002685
From molecular genetics to phylodynamics: evolutionary relevance of mutation rates across viruses
Abstract
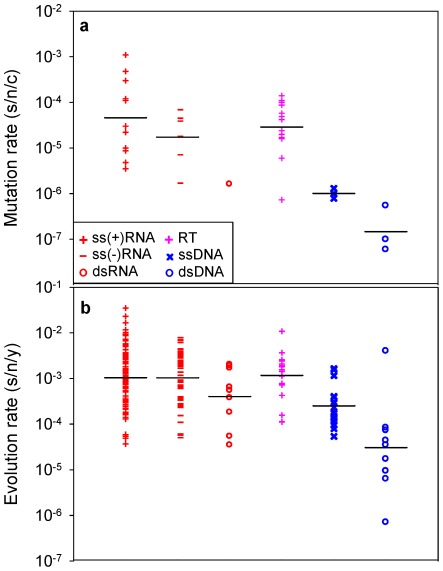
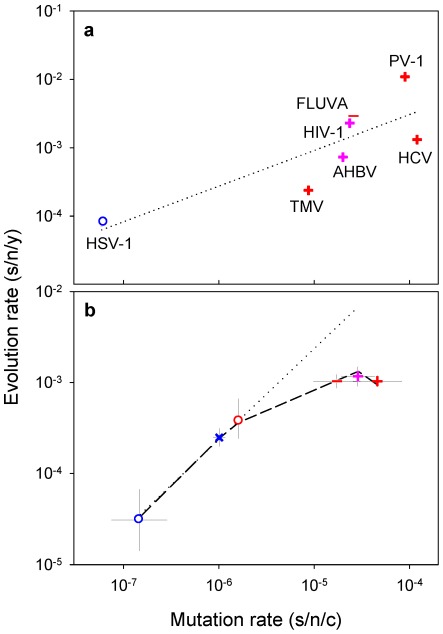
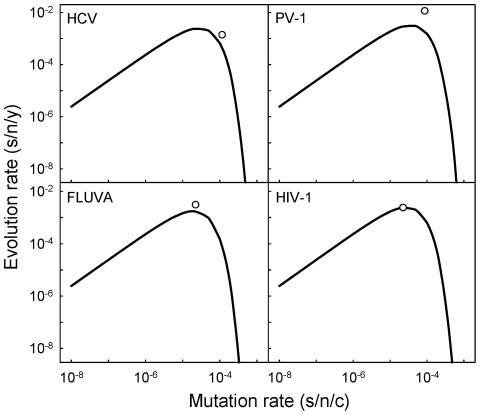
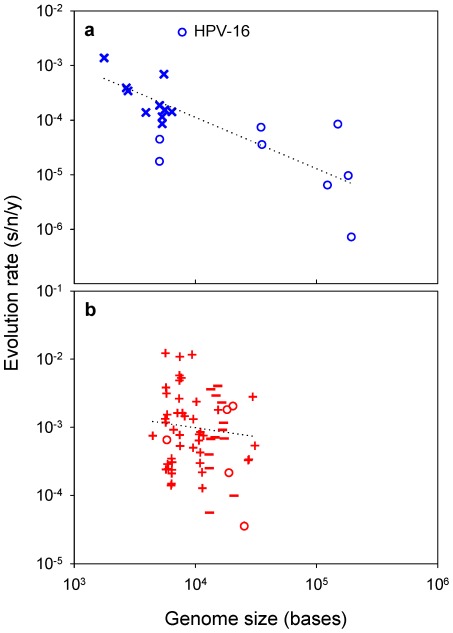
Although evolution is a multifactorial process, theory posits that the speed of molecular evolution should be directly determined by the rate at which spontaneous mutations appear. To what extent these two biochemical and population-scale processes are related in nature, however, is largely unknown. Viruses are an ideal system for addressing this question because their evolution is fast enough to be observed in real time, and experimentally-determined mutation rates are abundant. This article provides statistically supported evidence that the mutation rate determines molecular evolution across all types of viruses. Properties of the viral genome such as its size and chemical composition are identified as major determinants of these rates. Furthermore, a quantitative analysis reveals that, as expected, evolution rates increase linearly with mutation rates for slowly mutating viruses. However, this relationship plateaus for fast mutating viruses. A model is proposed in which deleterious mutations impose an evolutionary speed limit and set an extinction threshold in nature. The model is consistent with data from replication kinetics, selection strength and chemical mutagenesis studies.
Conflict of interest statement
The authors have declared that no competing interests exist.
Figures
References
-
- Kimura M. The neutral theory of molecular evolution. Cambridge: Cambridge University Press; 1983. 367
-
- Grenfell BT, Pybus OG, Gog JR, Wood JL, Daly JM, et al. Unifying the epidemiological and evolutionary dynamics of pathogens. Science. 2004;303:327–332. - PubMed
-
- Duffy S, Shackelton LA, Holmes EC. Rates of evolutionary change in viruses: patterns and determinants. Nat Rev Genet. 2008;9:267–276. - PubMed
Publication types
MeSH terms
Grants and funding
LinkOut - more resources
Full Text Sources
Other Literature Sources
