. 2012;8(4):e1002641.
doi: 10.1371/journal.pgen.1002641. Epub 2012 Apr 26.

Patterns of ancestry, signatures of natural selection, and genetic association with stature in Western African pygmies

Affiliations

Patterns of ancestry, signatures of natural selection, and genetic association with stature in Western African pygmies

Joseph P Jarvis et al. PLoS Genet. 2012.

Abstract

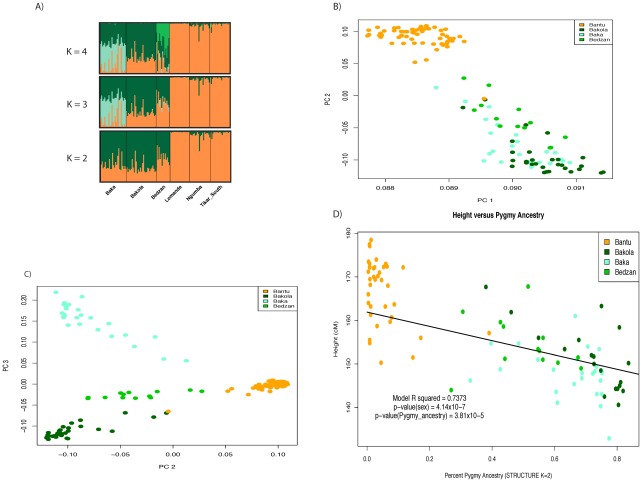
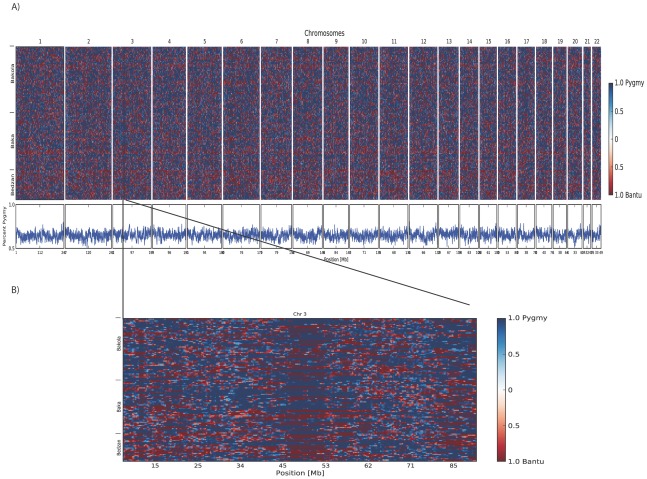
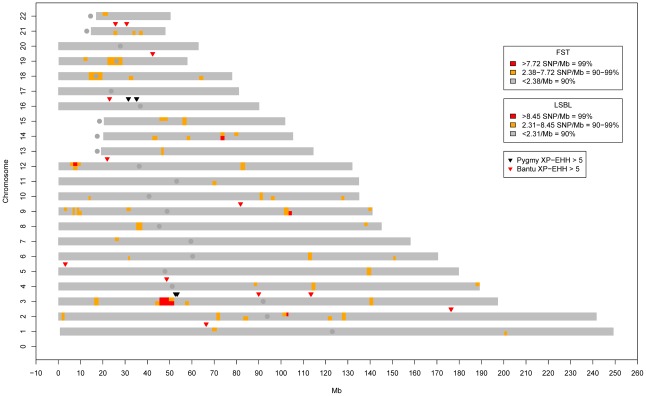
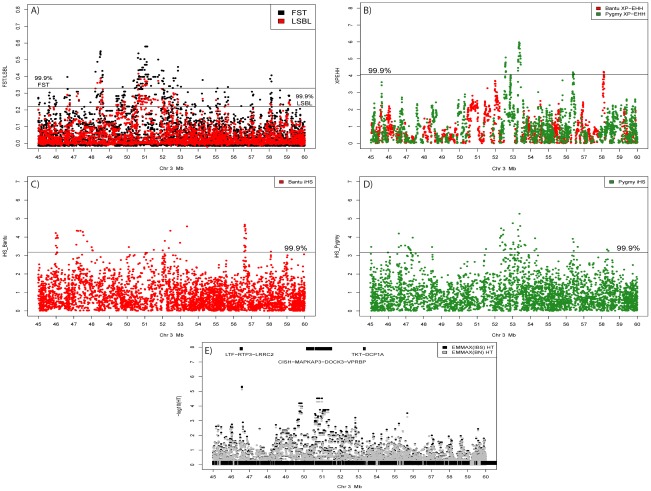
African Pygmy groups show a distinctive pattern of phenotypic variation, including short stature, which is thought to reflect past adaptation to a tropical environment. Here, we analyze Illumina 1M SNP array data in three Western Pygmy populations from Cameroon and three neighboring Bantu-speaking agricultural populations with whom they have admixed. We infer genome-wide ancestry, scan for signals of positive selection, and perform targeted genetic association with measured height variation. We identify multiple regions throughout the genome that may have played a role in adaptive evolution, many of which contain loci with roles in growth hormone, insulin, and insulin-like growth factor signaling pathways, as well as immunity and neuroendocrine signaling involved in reproduction and metabolism. The most striking results are found on chromosome 3, which harbors a cluster of selection and association signals between approximately 45 and 60 Mb. This region also includes the positional candidate genes DOCK3, which is known to be associated with height variation in Europeans, and CISH, a negative regulator of cytokine signaling known to inhibit growth hormone-stimulated STAT5 signaling. Finally, pathway analysis for genes near the strongest signals of association with height indicates enrichment for loci involved in insulin and insulin-like growth factor signaling.


Conflict of interest statement

The authors have declared that no competing interests exist.

Figures

Figure 1
Figure 1. Admixture and population structure.
Plots of principal components A) 1 versus 2 and B) 2 versus 3 calculated using 1M SNP data from 67 Pygmy and 58 Bantu samples. The proportion of variance explained by PCs 1, 2, and 3 is 0.245, 0.0192, and 0.0109, respectively. The three Pygmy ethnic groups are clearly distinguished from their neighboring Bantu populations by the first two PCs, while the third differentiates the three Pygmy groups from one another. C) Regression of height on Pygmy ancestry inferred using STRUCTURE (K = 2). Higher levels of Pygmy ancestry are associated with shorter stature. The trend line intersects the intercept from the full model and has a slope equal to the regression coefficient for percent ancestry. D) Visualization of percent ancestry inferred using STRUCTURE at K = 2, 3, and 4.
Figure 2
Figure 2. Results from local ancestry inference.
A) Genome-wide blocks of Pygmy and Bantu ancestry in Pygmy individuals. B) Blocks of Pygmy and Bantu ancestry in Pygmy individuals for chromosome 3. Shades of blue represent Pygmy ancestry and shades of red admixed Bantu ancestry. Shades are determined by the posterior probability of the estimates; darker colors indicate greater confidence. Each individual is represented by two horizontal rows (one for each haploid genome) and columns represent each window in the genome. Inferred percent Pygmy ancestry for each window is given below. Using SupportMix analysis, we determined the average ancestry block sizes in Pygmies to be 1.7+/−2.4 Mb for Pygmy ancestry, and 3.1+/−4.6 Mb for Bantu ancestry.
Figure 3
Figure 3. Genome-wide clusters of signals of natural selection in Pygmies.
Blocks of high genome-wide density based on SNPs/Mb for FST (top half of each chromosome) and Pygmy LSBL SNPs (bottom half of each chromosome) are shown. Also shown are XP-EHH signals >5.0 in the Pygmy (Black) and Bantu (Red). The only genomic location showing all three signals occurs on chromosome 3 roughly between 45 and 60 Mb. iHS results for this region are given in Figure 4C and 4D.
Figure 4
Figure 4. Signals of positive selection and association with height on chromosome 3 between 45 and 60 Mb.
A) Results from FST (Black) and Pygmy LSBL (Red) analysis. The region between ∼50 and 52 Mb contains the largest concentration in the genome of SNPs with scores in the 0.1% tail of the empirical distribution and contains the positional candidate genes CISH, MAPKAP3, and DOCK3. B) Results from XP-EHH analysis. Scores depicted in red show negative values indicating a signal in the Bantu samples, and scores in green show positive values indicating a signal in the Pygmy samples. C) Results from iHS analysis in the Bantu samples. D) Results from iHS analysis in the Pygmy samples. E) Results of association analysis for height (cm) using EMMAX with sex as a covariate. Two suggestive associations are evident. The first, at ∼46.5 Mb, occurs within the coding region of LRRC2. The second is a strong enrichment of association signals between ∼49.5 and 51 Mb directly corresponding to Pygmy-specific signals of positive selection in A–D, centered on the three positional candidates CISH, MAPKAP3 and DOCK3.

References

    1. Migliano AB, Vinicius L, Lahr MM. Life history trade-offs explain the evolution of human pygmies. Proc Natl Acad Sci U S A. 2007;104:20216–20219. - PMC - PubMed
    1. Perry GH, Dominy NJ. Evolution of the human pygmy phenotype. Trends Ecol Evol. 2009;24:218–225. - PubMed
    1. Batini C, Lopes J, Behar DM, Calafell F, Jorde LB, et al. Insights into the demographic history of African Pygmies from complete mitochondrial genomes. Mol Biol Evol. 2011;28:1099–1110. - PubMed
    1. Destro-Bisol G, Coia V, Boschi I, Verginelli F, Caglia A, et al. The analysis of variation of mtDNA hypervariable region 1 suggests that Eastern and Western Pygmies diverged before the Bantu expansion. Am Nat. 2004;163:212–226. - PubMed
    1. Patin E, Laval G, Barreiro LB, Salas A, Semino O, et al. Inferring the demographic history of African farmers and pygmy hunter-gatherers using a multilocus resequencing data set. PLoS Genet. 2009;5:e1000448. doi: 10.1371/journal.pgen.1000448. - DOI - PMC - PubMed

Publication types

Substances