. 2012;8(5):e1002673.
doi: 10.1371/journal.pgen.1002673. Epub 2012 May 3.

Principles of carbon catabolite repression in the rice blast fungus: Tps1, Nmr1-3, and a MATE-family pump regulate glucose metabolism during infection

Affiliations

Principles of carbon catabolite repression in the rice blast fungus: Tps1, Nmr1-3, and a MATE-family pump regulate glucose metabolism during infection

Jessie Fernandez et al. PLoS Genet. 2012.

Abstract

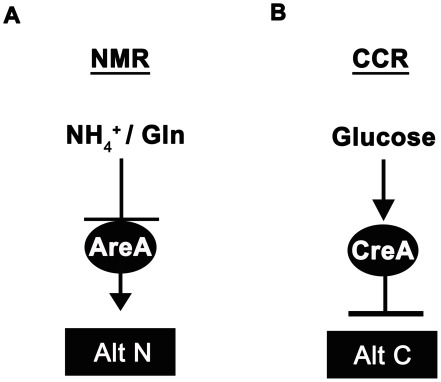
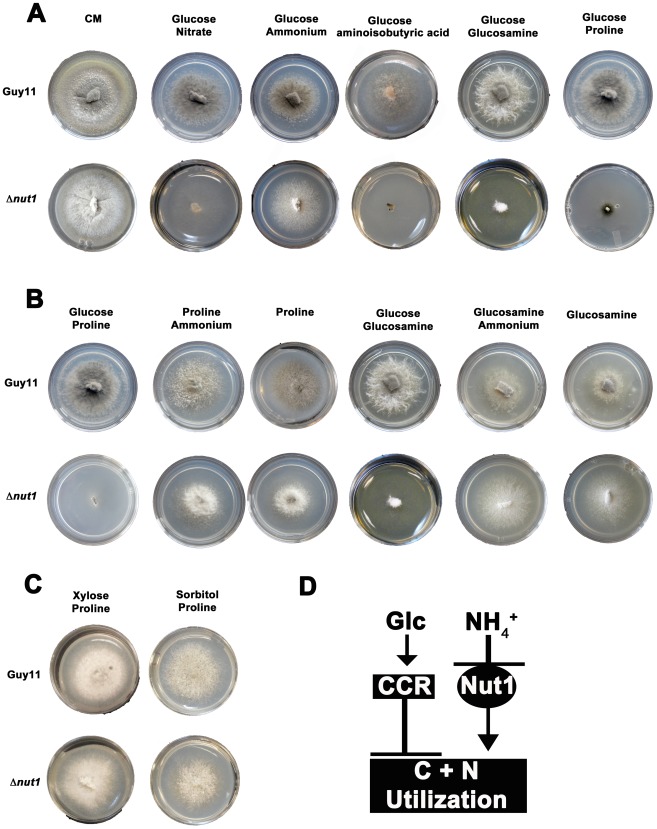
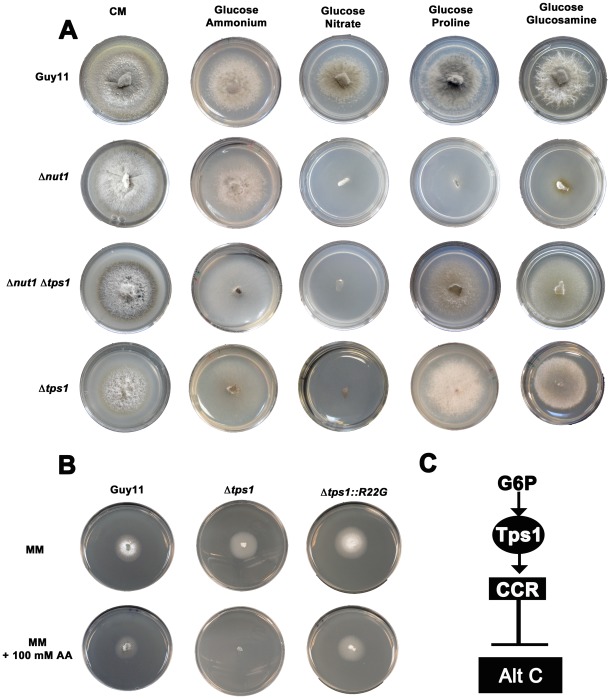
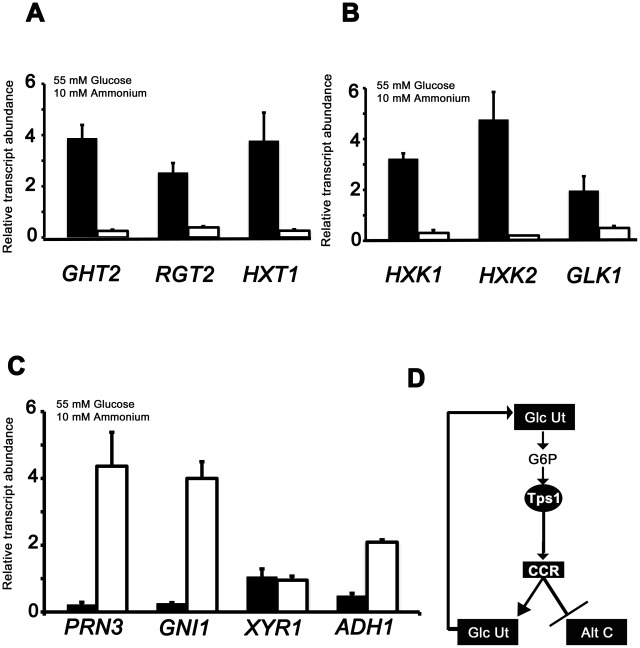
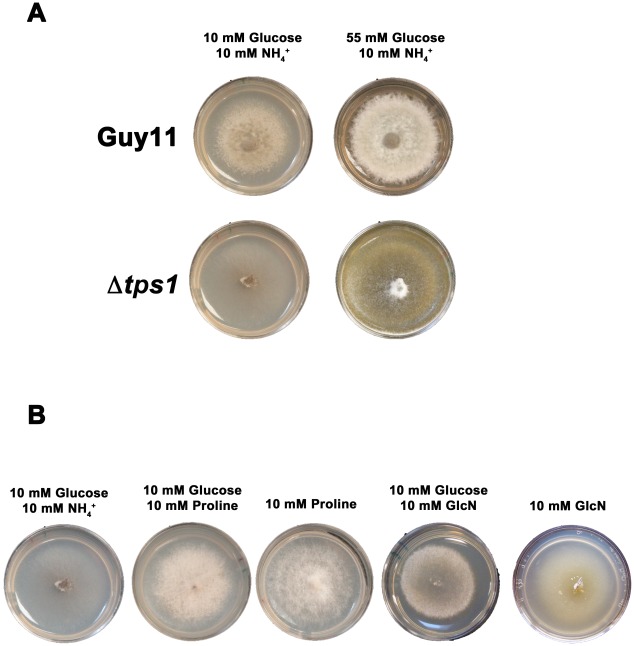
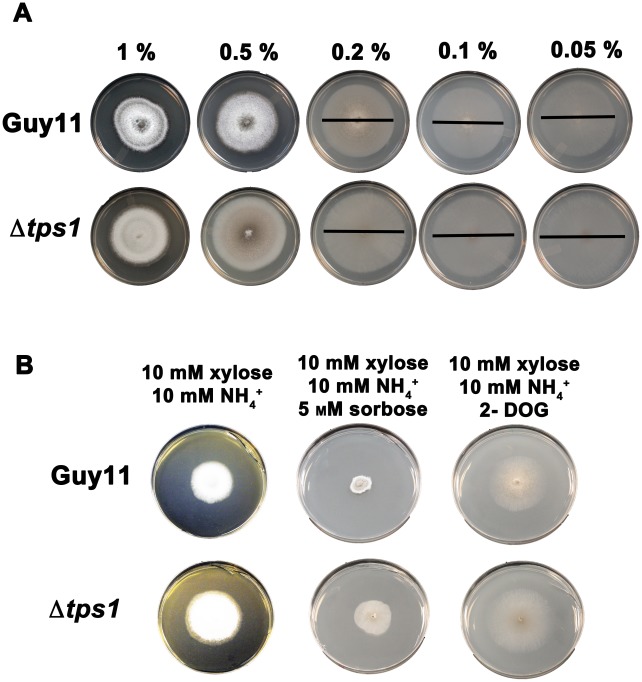
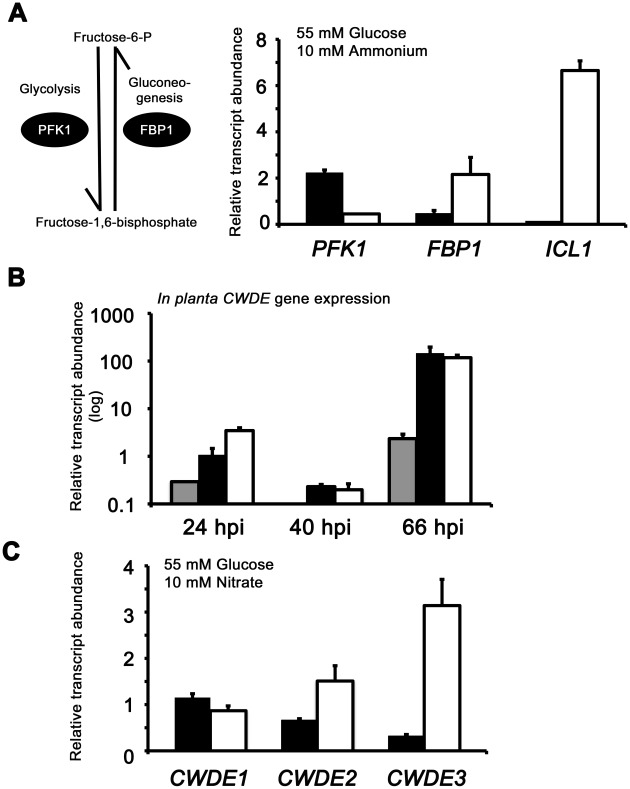
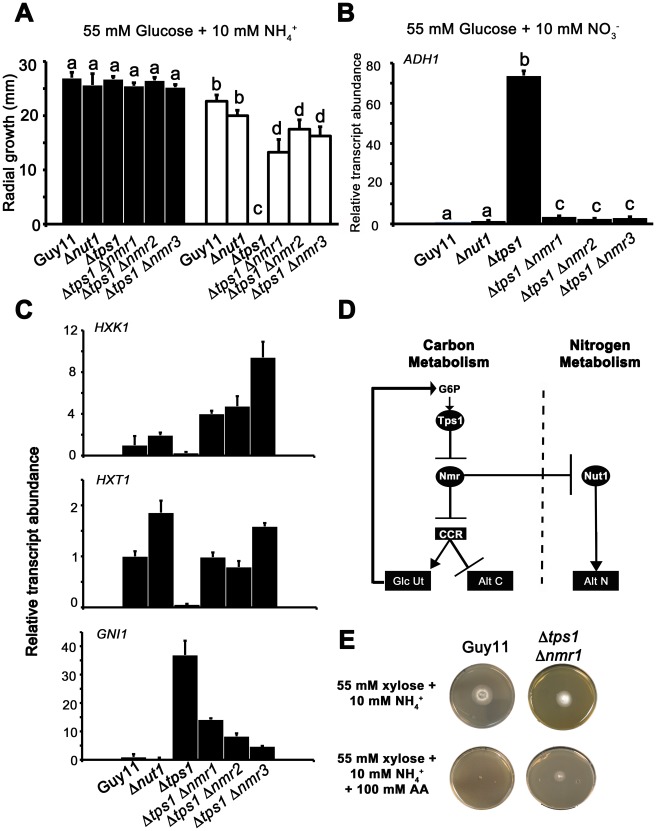
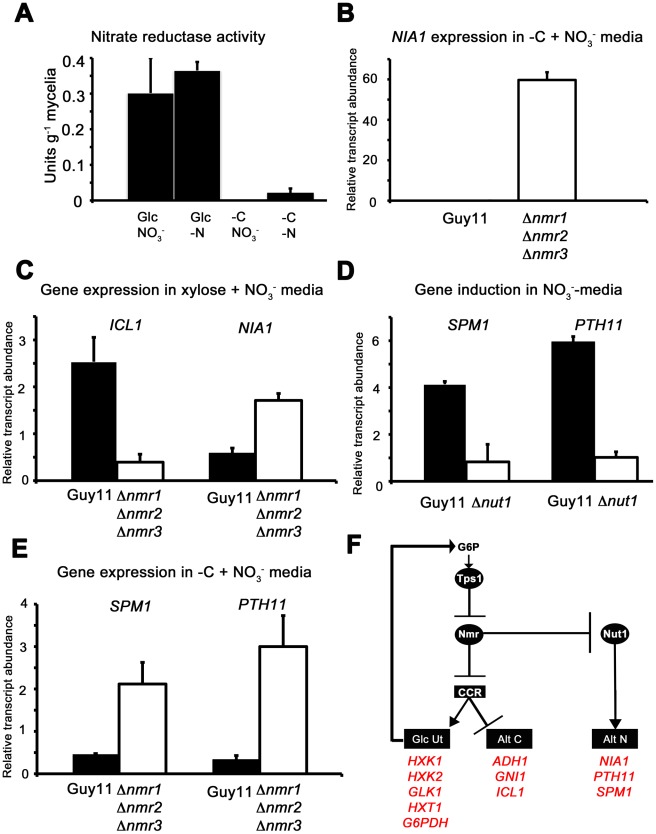
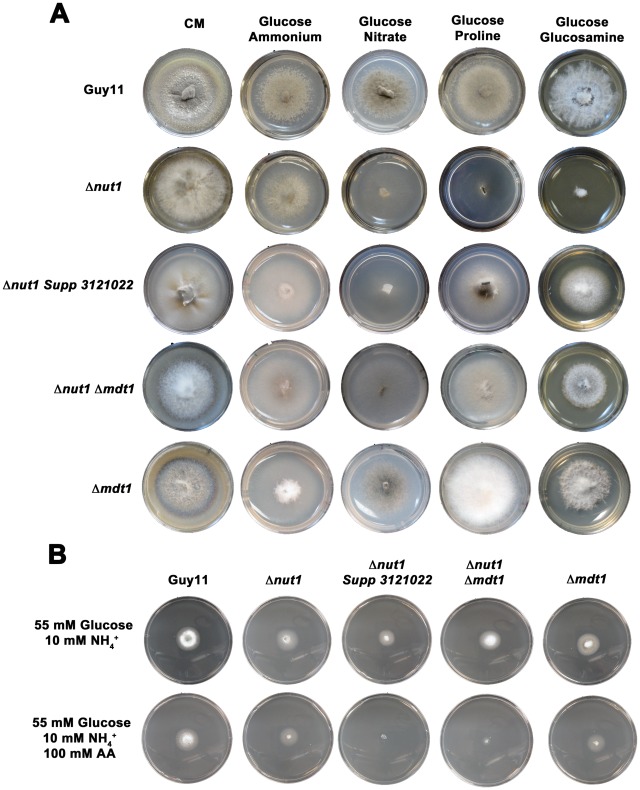
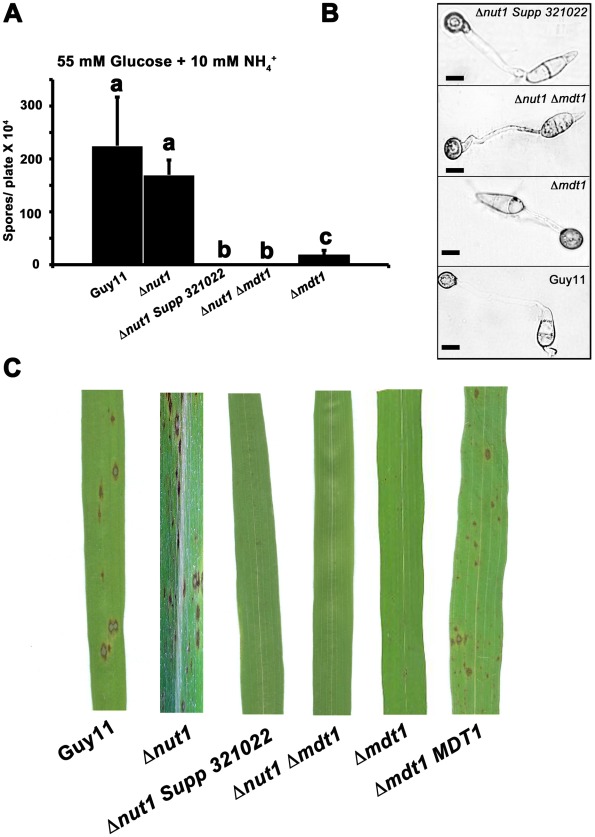
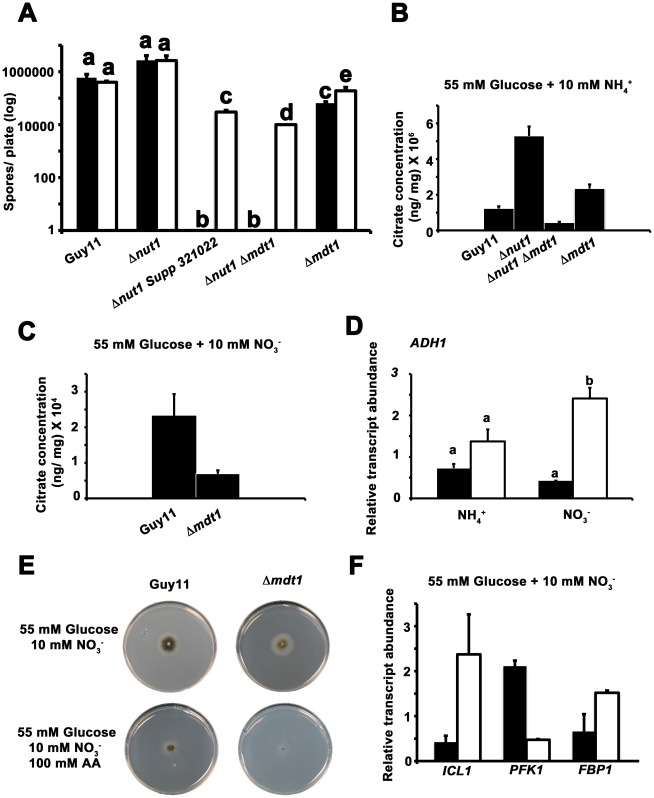
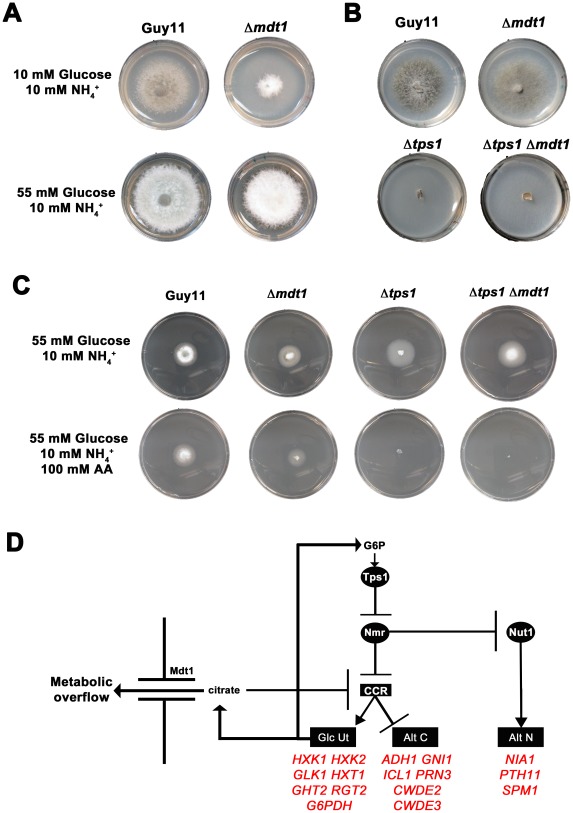
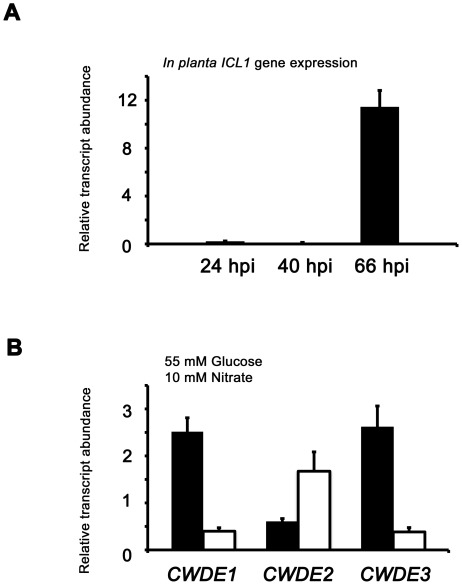
Understanding the genetic pathways that regulate how pathogenic fungi respond to their environment is paramount to developing effective mitigation strategies against disease. Carbon catabolite repression (CCR) is a global regulatory mechanism found in a wide range of microbial organisms that ensures the preferential utilization of glucose over less favourable carbon sources, but little is known about the components of CCR in filamentous fungi. Here we report three new mediators of CCR in the devastating rice blast fungus Magnaporthe oryzae: the sugar sensor Tps1, the Nmr1-3 inhibitor proteins, and the multidrug and toxin extrusion (MATE)-family pump, Mdt1. Using simple plate tests coupled with transcriptional analysis, we show that Tps1, in response to glucose-6-phosphate sensing, triggers CCR via the inactivation of Nmr1-3. In addition, by dissecting the CCR pathway using Agrobacterium tumefaciens-mediated mutagenesis, we also show that Mdt1 is an additional and previously unknown regulator of glucose metabolism. Mdt1 regulates glucose assimilation downstream of Tps1 and is necessary for nutrient utilization, sporulation, and pathogenicity. This is the first functional characterization of a MATE-family protein in filamentous fungi and the first description of a MATE protein in genetic regulation or plant pathogenicity. Perturbing CCR in Δtps1 and MDT1 disruption strains thus results in physiological defects that impact pathogenesis, possibly through the early expression of cell wall-degrading enzymes. Taken together, the importance of discovering three new regulators of carbon metabolism lies in understanding how M. oryzae and other pathogenic fungi respond to nutrient availability and control development during infection.


Conflict of interest statement

The authors have declared that no competing interests exist.

Figures

Figure 1
Figure 1. Ammonium and glucose are preferred nitrogen and carbon sources in filamentous fungi.
(A) Nitrogen metabolite repression (NMR) ensures the preferential utilization of ammonium (NH4 +) or L-glutamine as nitrogen sources by modulating the activity of a GATA family transcriptional activator (AreA in Aspergillus nidulans) necessary for the expression of genes involved in assimilating and utilizing alternative nitrogen sources (Alt N). (B) In the presence of glucose, carbon catabolite repression (CCR) acts via a negatively-acting transcriptional repressor (CreA in Aspergillus nidulans) to prevent the expression of genes required for utilizing alternative carbon sources (Alt C).
Figure 2
Figure 2. Compounds that are both carbon and nitrogen sources are subject to CCR and NMR.
(A) Plate tests of nitrogen utilization by Guy11 and Δnut1 strains in the presence of glucose. Strains were grown for 10 days on complete media (CM) or minimal media containing 10 mM glucose supplemented with 10 mM of the appropriate compound. Because Δnut1 strains are defective for nitrogen metabolite repression, they can grow on ammonium (NH4 +) as nitrogen source but cannot grow on alternative nitrogen sources that require a functional Nut1 protein, such as nitrate (NO3 ). In addition, Δnut1 strains cannot grow on aminoisobutyric acid, glucosamine and proline as sole nitrogen sources in the presence of glucose, demonstrating these compounds require an active Nut1 protein for utilization as nitrogen sources. (B) Both Guy11 and Δnut1 strains can metabolize glucosamine and proline as sole carbon sources in the presence or absence of a repressing nitrogen source, suggesting the utilization of these compounds as carbon sources is subject to CCR. (C) Replacement of glucose with the derepressing (i.e. CCR inactivating) carbon sources xylose or sorbitol fully restores the ability of Δnut1 strains to use proline as a nitrogen source, confirming these genes are under dual CCR and NMR. (D) Taken together, the expression of genes required for metabolizing compounds that are both nitrogen and carbon sources (represented by the box labeled C+N utilization) are subject to both CCR and NMR. Glc is glucose. CCR represents a signal transduction pathway of unknown components leading to glucose repression. Nut1 is the Nut1 protein.
Figure 3
Figure 3. Tps1 regulates CCR in response to G6P sensing.
(A) CCR is Tps1 dependent. Strains were grown for 10 days on CM or minimal media supplemented with 10 mM of the appropriate carbon and nitrogen source. Like Δnut1, Δtps1 and Δtps1 Δnut1 strains are unable to utilize nitrate as nitrogen source. However, deleting the TPS1 gene in Δnut1 strains restores growth on proline and glucosamine as nitrogen sources, demonstrating that CCR is inactivated in Δtps1- carrying strains. (B) G6P sensing by Tps1 activates CCR. To mitigate against AA evaporation, best results were obtained when Guy11, Δtps1 and Δtps1::R22G strains were grown for 5 days on 85 mm petri dishes containing either glucose-rich minimal media with 55 mM glucose and 10 mM NH4 + as sole carbon and nitrogen sources, respectively, or the same medium supplemented with 100 mM of the toxic analogue allyl alcohol (AA). Δtps1 strains were sensitive to 100 mM allyl alcohol, indicating they are carbon derepressed (i.e. CCR is inactivated) in the presence of glucose. Like Guy11, Δtps1::R22G strains were not sensitive to 100 mM allyl alcohol, suggesting CCR operates correctly in the Δtps1::R22G G6P sensing strains. (C) G6P sensing by Tps1 is the trigger for CCR resulting in the inhibition of alternative carbon source (Alt C) utilization by M. oryzae.
Figure 4
Figure 4. qPCR analysis of Tps1-dependent gene expression.
The expression of carbon metabolizing genes were analyzed in strains of Guy11 (black bars) and Δtps1 (open bars) that were grown in CM media for 48 hr before switching to 55 mM glucose+10 mM NH4 + minimal media for 16 hr. Gene expression results were normalized against expression of the ß-tubulin gene (TUB2). Results are the average of at least three independent replicates, and error bars are the standard deviation. (A) The expression of three genes encoding putative glucose transporters, GHT2, RGT2 and HXT1, is Tps1-dependent. (B) qPCR analysis of hexose kinase gene expression in Guy11 and Δtps1 strains shows that HXK1, HXK2 and GLK1 expression is Tps1-dependent. (C) Tps1 is required for repressing proline (PRN3) glucosamine (GNI1) and alcohol (ADH1) metabolic gene expression during growth on glucose-containing media. (D) Based on plate tests and transcriptional data, we propose available glucose is taken up into the cell and phosphorylated to G6P by hexose transporters and hexose kinases, collectively termed glucose utilization processes (Glc Ut). In response to G6P sensing, Tps1 activates CCR, leading to the repression of genes required for alternative carbon source utilization (Alt C) and the expression of genes required for glucose utilization (Glc Ut), which would in turn increase the availability of G6P in the cell.
Figure 5
Figure 5. Glucose metabolism is impaired in Δtps1 strains.
(A) Guy11 and Δtps1 strains were grown for 10 days on minimal media containing 10 mM NH4 + and either 10 mM or 55 mM (1%) glucose. Δtps1 strains grew better on 55 mM glucose. (B) Δtps1 strains were grown for 10 days on minimal media containing the indicated carbon and nitrogen sources. Better growth was obtained when an alternative carbon source to glucose – such as proline or glucosamine (GlcN) - was used.
Figure 6
Figure 6. Glucose uptake and phosphorylation is not impaired in Δtps1 strains.
(A) To determine if Δtps1 strains were defective in glucose uptake, Guy11 and Δtps1 were grown for 10 days on 85 mm petri-dishes containing minimal media with 10 mM NH4 + and glucose at final concentrations in the range of 1%–0.05% (indicated above the plates). Δtps1 radial growth was not reduced compared to Guy11 at low glucose concentrations. The diameters of sparsely growing colonies on low glucose media are indicated with a black bar for ease of viewing. (B) To determine if Δtps1 strains were defective in glucose uptake, Guy11 and Δtps1 were grown for 10 days on 85 mm petri-dishes containing carbon derepressing minimal media consisting of 10 mM xylose+10 mM NH4 + as sole carbon and nitrogen sources and the same media supplemented with 5 mM sorbose or 50 µg/mL 2-deoxyglucose (2-DOG). Δtps1 were not more resistant to sorbose or 2-DOG compared to Guy11, suggesting glucose uptake and phosphorylation is not significantly impaired in Δtps1 strains.
Figure 7
Figure 7. Inactivating CCR in Δtps1 strains results in the misregulated expression of genes for assimilating glucose and metabolizing alternative carbon sources.
(A) Phosphofructokinase (PFK1) and fructose-1,6-bisphosphatase (FBP1) are glycolytic and gluconeogenic enzymes, respectively, which catalyze the interconversion of fructose-6-phosphate and fructose-1,6-bisphosphate (left panel). Right panel, PFK1 gene expression is elevated in Guy11 strains (black bars) compared to Δtps1 strains (open bars) when grown on minimal media with glucose as sole carbon source. FBP1 and ICL1 - encoding isocitrate lyase involved in gluconeogenesis - are elevated in expression in Δtps1 strains compared to Guy11 strains when grown on glucose minimal media. Strains were grown in CM media for 48 hr before switching to 55 mM glucose+10 mM NH4 + minimal media for 16 hr (following [23]). Gene expression results were normalized against expression of the ß-tubulin gene (TUB2). Results are the average of at least three independent replicates, and error bars are the standard deviation. (B) Cell wall degrading enzymes (CWDEs) have been shown to be under the control of CCR in M. oryzae. To confirm the expression of genes encoding ß-glucosidase 1 (gray bar), feruloyl esterase B (closed bar) and exoglucanase (open bar) during infection by Guy11, their expression was monitored at 24, 40 and 66 hpi and shown to be highly expressed when necrotic lesions were developing. Due to cross-reactivity between fungal and rice ß-tubulin orthologues, gene expression results were normalized against expression of the M. oryzae actin gene (ACT1). Results are the average of at least three independent replicates, and error bars are the standard deviation. (C) To determine if ß-glucosidase 1, feruloyl esterase B and exoglucanase encoding genes (labeled CWDE1, CWDE2 and CWDE3, respectively) are subject to Tps1-dependent CCR, their expression was monitored in Guy11 and Δtps1 strains following growth in CM for 48 hr and a shift into minimal media with 55 mM glucose and 10 mM NO3 for 16 hr. Gene expression results were normalized against expression of the ß-tubulin gene (TUB2). Results are the average of at least three independent replicates, and error bars are the standard deviation.
Figure 8
Figure 8. The Nmr1-3 inhibitor proteins regulate CCR independently of Nut1.
(A) Guy11, Δnut1, Δtps1, Δtps1 Δnmr1, Δtps1 Δnmr2, and Δtps1 Δnmr3 strains were grown on minimal media with 55 mM glucose and 10 mM NH4 + as sole carbon and nitrogen sources (closed bars), or the same media supplemented with 100 mM of the toxic analogue allyl alcohol (open bars). Strains were grown for 5 days, and radial diameters were measured. Results are the average of three independent replicates. Error bars are standard deviation. Bars with the same letters are not significantly different (Student's t-test p≤0.01). (B) The expression of ADH1 was analyzed in Guy11, Δnut1, Δtps1, Δtps1 Δnmr1, Δtps1 Δnmr2, and Δtps1 Δnmr3 strains that were grown in CM media for 48 hr before switching to 55 mM glucose+10 mM NO3 minimal media for 16 hr (following [23]). Gene expression results were normalized against expression of the ß-tubulin gene (TUB2) and given relative to the expression of ADH1 in Guy11. Results are the average of at least three independent replicates, and error bars are the standard deviation. (C) The expression of HXK1 (top panel), HXT1 (middle panel) and GNI1 (bottom panel), was analyzed in strains that were grown in CM media for 48 hr before switching to 55 mM glucose+10 mM NO3 minimal media for 16 hr. This media was chosen to determine if genes subjected to CCR are expressed independently of Nut1. Gene expression results were normalized against expression of the ß-tubulin gene (TUB2) and given relative to the expression of each gene in Guy11. Results are the average of at least three independent replicates, and error bars are the standard deviation. (D) Model for control of CCR and nitrogen metabolite repression in response to G6P. CCR is a signal transduction pathway of unknown components that responds to glucose by inhibiting alternative carbon source utilization (Alt C) and promoting glucose uptake and utilization (Glc Ut) via feed-forward transcriptional regulation. In the absence of glucose, the Nmr1-3 inhibitor proteins inactivate CCR, resulting in carbon derepression, while G6P sensing by Tps1 results in Nmr1-3 inactivation and active CCR. The Nmr1-3 inhibitor proteins also negatively regulate Nut1 to control alternative nitrogen source utilization (Alt N), but Nut1 plays no role in CCR, demonstrating for the first time independent roles for the Nmr1-3 inhibitor proteins in regulating carbon and nitrogen metabolism in response to glucose. (E) Guy11 strains are susceptible to allyl alcohol (AA) toxicity when grown on a derepressing carbon source such as xylose. Consistent with a role for Nmr inhibitor proteins in suppressing CCR, the Δtps1 Δnmr1 double mutant strain is shown to be partially resistant to 100 AA under carbon derepressing growth conditions (minimal media with 55 mM xylose as sole carbon source), suggesting CCR is at least partially active and suppressing alternative carbon utilization pathways (Alt C), in the absence of glucose, in strains lacking at least Nmr1 activity.
Figure 9
Figure 9. The Nmr1-3 inhibitor proteins regulate nitrogen and carbon metabolism in response to G6P.
(A) As predicted by our model in Figure 8D, Nitrate reductase activity is dependent on glucose availability. Nitrate reductase activity was determined as described in , where strains were grown in CM media for 48 hr before switching to minimal media containing either 55 mM glucose (Glc) or no carbon source (-C), with 10 mM nitrate (NO3 ) or no nitrogen source (-N). Enzyme activity is given as units of nitrate reductase activity per gram of lyophilized mycelia. Results are the average of at least three independent replicates and bars are standard deviation. (B) NIA1 expression was analyzed in Guy11 and Δnmr1 Δnmr2 Δnmr3 triple mutant strains following growth in CM for 48 hr followed by growth in nitrate minimal media lacking a carbon source for 16 hr. Gene expression results were normalized against expression of the ß-tubulin gene (TUB2). Results are the average of at least three independent replicates, and error bars are the standard deviation. (C) ICL1 and NIA1 gene expression was analyzed in Guy11 and Δnmr1 Δnmr2 Δnmr3 triple mutant strains following growth in CM for 48 hr followed by growth in carbon and nitrogen derepressing minimal media (55 mM xylose+10 mM NO3 ). Gene expression results were normalized against expression of the ß-tubulin gene (TUB2). Results are the average of at least three independent replicates, and error bars are the standard deviation. (D) To explore how the expression of characterized virulence factors, known to be expressed in nitrogen starvation conditions are controlled, we first confirmed that SPM1 and PTH11 are elevated in expression on 55 mM glucose+10 mM NO3 minimal media compared to growth on 55 mM glucose+10 mM NH4 +, and that this induction is abolished in Δnut1 strains. Gene expression results were normalized against expression of the ß-tubulin gene (TUB2) and are relative to their expression in NH4 +-containing minimal media. Results are the average of at least three independent replicates, and error bars are the standard deviation. (E) Having confirmed that SPM1 and PTH11 gene expression is nitrate inducible in a Nut1-dependent manner, we next analyzed whether they were regulated by the Nmr1-3 inhibitor proteins. We looked at the expression of these genes on −C+10 mM NO3 minimal media in Guy11 and the Δnmr1 Δnmr2 Δnmr3 triple mutant strains, and found they were significantly elevated in expression in the latter strain compared to Guy11. Gene expression results were normalized against expression of the ß-tubulin gene (TUB2). Results are the average of at least three independent replicates, and error bars are the standard deviation. (F) Summary of gene regulation discussed in Figure 8 and 9.
Figure 10
Figure 10. Disruption of Mdt1 function affects carbon metabolism.
(A) Strains were grown for 10 days on CM or minimal media supplemented with 10 mM of the appropriate carbon and nitrogen source. Like the Δnut1 parental strain, both Δnut1 Supp 321022 extragenic suppressor strains and Δnut1 Δmdt1 double deletion strains were unable to grow on NO3 - containing media. Unlike the Δnut1 parental strain, both MDT1 disruption strains were restored for growth on proline and glucosamine as nitrogen source, indicating T-DNA insertion or homologous gene replacement of MDT1 resulted in carbon derepression in the presence of glucose. (B) Disruption of MDT1 in the Δnut1 background resulted in strains that were carbon catabolite derepressed and significantly reduced in growth on 55 mM glucose+10 mM NH4 + minimal media with 100 mM AA compared to growth on NH4 + minimal media alone. Single Δmdt1 deletion strains were less sensitive to 100 mM AA on this media.
Figure 11
Figure 11. Disrupting Mdt1 function affects sporulation and pathogenesis.
(A) MDT1 disruption mutants were impaired in spore production on minimal media. Spores were harvested from plates following 12 days of growth. Values are the mean of at least three independent replicates. Error bars are standard deviation. Bars with the same letter are not significantly different (Student's t-test p≤0.01). (B) The Δnut1 Supp 321022 suppressor strain, the Δnut1 Δmdt1 double deletion strain and the Δmdt1 single mutant form appressoria on artificial hydrophobic surfaces. Spores of Guy11, the Δnut1 Supp 321022 suppressor strain, the Δnut1 Δmdt1 double deletion strain and Δmdt1 strains were applied to plastic cover slips. Scale bars are 10 µM. (C) The MATE-family efflux pump Mdt1 is essential for pathogenesis in Δnut1 strains. Because of the reduced sporulation rates of MDT1 disruption strains, spores were inoculated onto rice leaves at a low rate of 2×10⁴ spores/mL. Compared to Guy11 and Δnut1 parental strains, Δmdt1, Δnut1 Δmdt1 and Δnut1 Supp 321022 strains were unable to cause the necrotic lesions associated with successful rice infection. Introducing the full length MDT1 coding region into Δmdt1 strains restored pathogenicity in Δmdt1 MDT1 complementation strains.
Figure 12
Figure 12. Elucidating the function of the Mdt1 efflux protein.
(A) Sporulation of the Δnut1 Supp 321022 suppressor strain, the Δnut1 Δmdt1 double deletion strain, and the Δmdt1 single deletion strain, but not the Guy11 or Δnut1 parental strains, was significantly increased (Student's t-test p≤0.05) on minimal media comprising 55 mM glucose and 10 mM NH4 + and containing ten-fold more zinc (open bars) than the same media with standard zinc concentrations (closed bars). Spores were harvested from plates following 12 days of growth. Log scale is used. Values are the average of three independent replicates and error bars are the standard deviation. (B) Strains were grown in CM for 48 hr before switching to minimal media with 55 mM glucose and 10 mM NH4 + or (C) 10 mM NO3 as sole nitrogen sources for 16 hr. Citrate was measured in the media using LC-MS/MS and quantified against known concentrations of citrate. Values are the mean of at least three independent replicates. Error bars are standard deviation. (D) ADH1 gene expression was analyzed in strains of Guy11 (closed bars) and Δmdt1 (open bars) after 16 hr expression in minimal media with 10 mM NO3 or 10 mM NH4 + as sole nitrogen source, and 55 mM glucose as carbon source, following a switch from CM media. Gene expression results were normalized against expression of the ß-tubulin gene (TUB2). Results are the average of at least three independent replicates, and error bars are the standard deviation. Bars with the same letter are not significantly different (Student's t-test p≤0.05). (E) Δmdt1 strains are carbon derepressed on minimal media with 55 mM glucose+10 mM NO3 and show increased sensitivity to 100 mM AA on this media compared to Guy11. Strains were grown for 5 days on 85 mm plates. (F) Compared to Guy11 strains, growth of Δmdt1 strains on minimal media with 55 mM glucose+10 mM NO3 results in changes to ICL1, PFK1 and FBP1 gene expression. Gene expression results were normalized against expression of the ß-tubulin gene (TUB2). Results are the average of at least three independent replicates and error bars are the standard deviation.
Figure 13
Figure 13. TPS1 is epistatic to MDT1 in the regulation of CCR.
(A) Like Δtps1 strains, Δmdt1 strains are impaired for growth on NH4 +-minimal media with 10 mM glucose compared to Guy11, but grow stronger on NH4 +-minimal media with 55 mM glucose. (B) Unlike Δtps1 and Δtps1 Δmdt1 strains, single Δmdt1 deletion strains can utilize 10 mM NO3 as a nitrogen source suggesting TPS1 is epistatic to MDT1. (C) Δmdt1 single mutant strains are less sensitive to 55 mM Glc+10 mM NH4 + minimal media containing mM AA than Δtps1 and Δtps1 Δmdt1 strains. Strains were grown for 5 days on 85 mm plates. (D) We propose under sugar-rich conditions, such as those found in the interior of the rice leaf, G6P sensing by Tps1 inactivates the Nmr1-3 inhibitor protiens via elevated NADPH levels as described in . This results in both the derepression of GATA factor activity and the activation of CCR. CCR inhibits the expression of genes for alternative carbon source utilization and promotes the expression of genes for glucose utilization. Excess glucose would lead to overflow metabolism and citrate accumulation in the cell, and Mdt1 is necessary for the extrusion of citrate. Because loss of Mdt1 function inactivates CCR, we propose that citrate accumulation in the cell directly or indirectly inhibits CCR downstream of Tps1 and the Nmr1-3 inhibitor proteins. When G6P is exhausted, such as when the fungus has killed the leaf cell and no more photosynthesis is occurring, the Nmr1-3 inhibitor proteins would become active, blocking CCR and promoting the expression of genes for alternative carbon source utilization, including the large number of CWDEs first reported here. Glc is glucose. Glc Ut is glucose utilization. Alt C is alternative carbon source utilization. GATA represents the Asd4 and Nut1 GATA family transcription factors that are known to form physical interactions with Nmr1 .
Figure 14
Figure 14. Transcript analysis supports a role for CCR as an important regulator of gene expression during rice infection.
(A) During plant infection by Guy11, ICL1 encoding isocitrate lyase is expressed late in infection during the necrotic stage of disease. ICL1 expression was monitored at 24, 40 and 66 hpi and shown to be highly expressed after necrotic lesions had developed. Due to cross-reactivity between fungal and rice ß-tubulin orthologues, gene expression results were normalized against expression of the M. oryzae actin gene (ACT1). Results are the average of at least three independent replicates, and error bars are the standard deviation. (B) CWDE gene expression is altered in Δmdt1 mutant strains (open bars) compared to Guy11 (closed bars) following growth on CM for 48 hr followed by a switch to minimal media with 55 mM glucose and 10 mM NO3 for 16 hr. CWDE1 encodes ß-glucosidase 1, CWDE2 encodes feruloyl esterase B and CWDE3 encodes exoglucanase. Gene expression results were normalized against expression of the ß-tubulin gene (TUB2). Results are the average of at least three independent replicates, and error bars are the standard deviation.

References

    1. Marzluf GA. Genetic regulation of nitrogen metabolism in the fungi. Microbiol Mol Biol Rev. 1997;61:17–32. - PMC - PubMed
    1. Arst HN, Cove DJ. Nitrogen metabolite repression in Aspergillus nidulans. Mol Gen Genet. 1973;126:111–141. - PubMed
    1. Bailey C, Arst HN. Carbon catabolite repression in Aspergillos nidulans. Eur J Biochem. 1975;51:573–577. - PubMed
    1. Dowzer CE, Kelly JM. Analysis of the creA gene, a regulator of carbon catabolite repression in Aspergillus nidulans. Mol Cell Biol. 1991;11:5701–5709. - PMC - PubMed
    1. Caddick MX, Peters D, Platt A. Nitrogen regulation in fungi. Antonie Van Leeuwenhoek. 1994;65:169–177. - PubMed

Publication types