. 2012;7(5):e35955.
doi: 10.1371/journal.pone.0035955. Epub 2012 May 3.

Acoustic overexposure increases the expression of VGLUT-2 mediated projections from the lateral vestibular nucleus to the dorsal cochlear nucleus

Affiliations

Acoustic overexposure increases the expression of VGLUT-2 mediated projections from the lateral vestibular nucleus to the dorsal cochlear nucleus

Matthew Barker et al. PLoS One. 2012.

Abstract

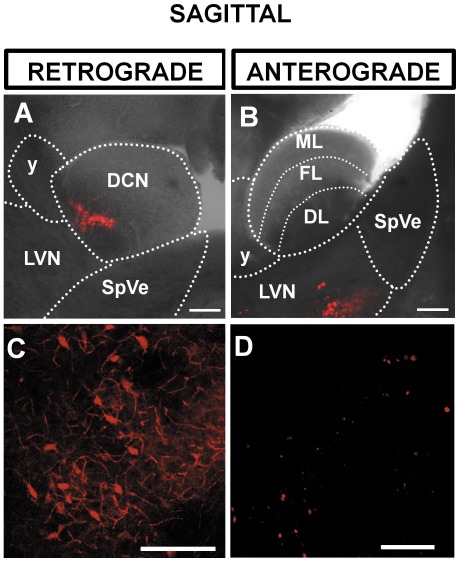
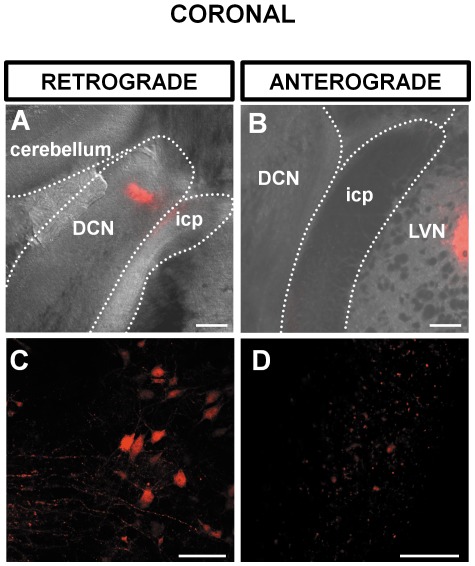
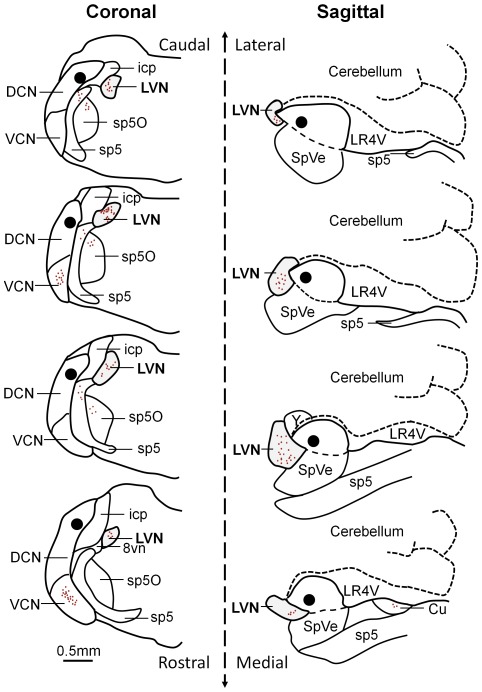
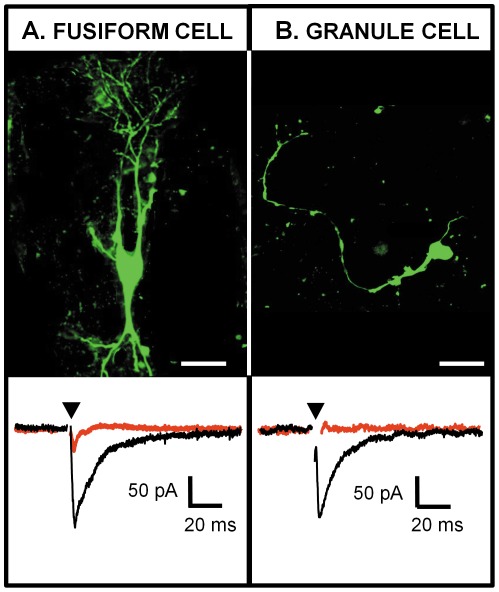
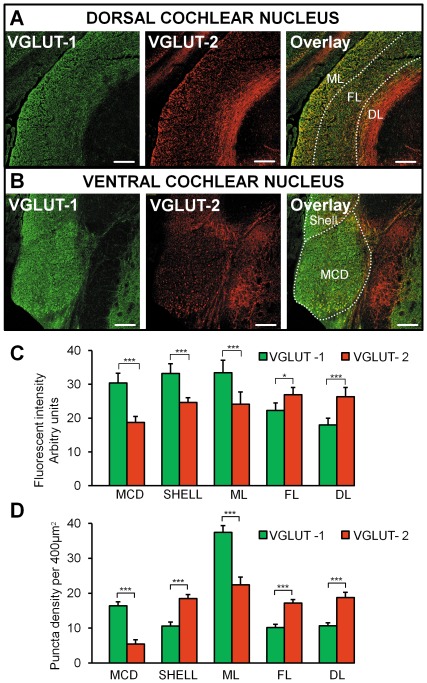
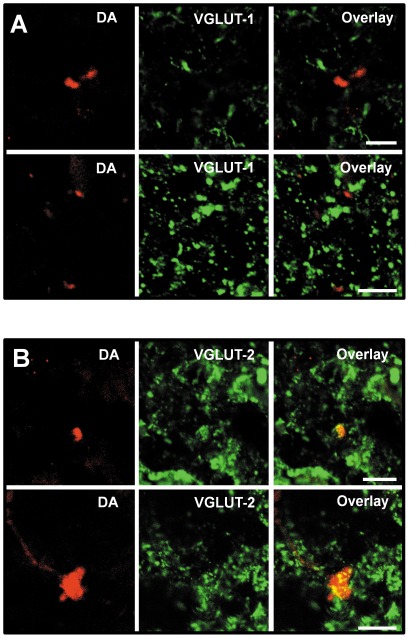
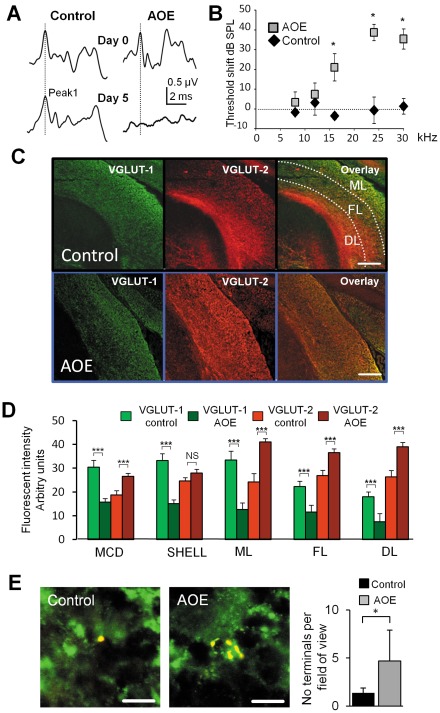
The dorsal cochlear nucleus (DCN) is a first relay of the central auditory system as well as a site for integration of multimodal information. Vesicular glutamate transporters VGLUT-1 and VGLUT-2 selectively package glutamate into synaptic vesicles and are found to have different patterns of organization in the DCN. Whereas auditory nerve fibers predominantly co-label with VGLUT-1, somatosensory inputs predominantly co-label with VGLUT-2. Here, we used retrograde and anterograde transport of fluorescent conjugated dextran amine (DA) to demonstrate that the lateral vestibular nucleus (LVN) exhibits ipsilateral projections to both fusiform and deep layers of the rat DCN. Stimulating the LVN induced glutamatergic synaptic currents in fusiform cells and granule cell interneurones. We combined the dextran amine neuronal tracing method with immunohistochemistry and showed that labeled projections from the LVN are co-labeled with VGLUT-2 by contrast to VGLUT-1. Wistar rats were exposed to a loud single tone (15 kHz, 110 dB SPL) for 6 hours. Five days after acoustic overexposure, the level of expression of VGLUT-1 in the DCN was decreased whereas the level of expression of VGLUT-2 in the DCN was increased including terminals originating from the LVN. VGLUT-2 mediated projections from the LVN to the DCN are likely to play a role in the head position in response to sound. Amplification of VGLUT-2 expression after acoustic overexposure could be a compensatory mechanism from vestibular inputs in response to hearing loss and to a decrease of VGLUT-1 expression from auditory nerve fibers.


Conflict of interest statement

Competing Interests: The authors have declared that no competing interests exist.

Figures

Figure 1
Figure 1. Sagittal brainstem slice showing a retrograde labelling of the lateral vestibular nucleus (LVN) following injection of dextran amine in the dorsal cochlear nucleus (DCN) (A,C) and an anterograde labelling of the DCN following injection of dextran amine in the LVN (B,D).
(A) Overlay of a brightfield and fluorescence photomicrograph at 3 hours post injection of dextran amine showing the position of the LVN and the DCN relative to the spinal vestibular nucleus (SpVe) and the nucleus Y (y). The fluorescence in the DCN shows the injection site. (B) The LVN is labeled as a result of retrograde transport of dextran amine. (C) Overlay of a brightfield and fluorescence photomicrograph showing the injection site in the LVN. (D) Labeled terminals in the DCN as a result of anterograde transport of dextran amine. Scale bar: (A) and (B) 200 µm, (C) and (D) 20 µm. All slices are 120 µm thick. ML: molecular layer; FL: fusiform cell layer; DL: deep layer.
Figure 2
Figure 2. Coronal brainstem slice showing a retrograde labelling of LVN following injection of dextran amine in the DCN (A,C) and an anterograde labelling of the DCN following injection of dextran amine in the LVN (B,D).
(A) Overlay of a brightfield and fluorescence photomicrograph at 3 hours post injection of dextran amine showing the position of the DCN relatively to the inferior cerebellar peduncle (icp) and the cerebellum. The fluorescence in the DCN shows the injection site. (B) The LVN is labeled as a result of retrograde transport of dextran amine. (C) Overlay of a brightfield and fluorescence photomicrograph showing the position of the dextran amine injection site in the LVN. (D) Labeled terminals in the DCN as a result of anterograde transport of dextran amine. Scale bar: (A) and (B) 200 µm, (C) and (D) 20 µm. All slices are 120 µm thick.
Figure 3
Figure 3. Reconstruction of retrograde cell body labelling in the LVN following an injection of dextran amine in the DCN.
Injections were performed on coronal (left) and sagittal (right) brainstem preparations and serial sections of 100 µm were performed. The black area represents the injection site in the DCN and the red dots represent labelled cell bodies including those in the LVN (grey area). LVN: lateral vestibular nucleus; DCN: dorsal cochlear nucleus; VCN: ventral cochlear nucleus; icp: inferior cerebellar peduncle; sp5: spinal trigeminal tract; sp5O: spinal trigeminal nucleus; 8vn: vestibular route of 8th nerve; SpVe: spinal vestibular nucleus; LR4V: lateral recess 4th ventricle; Cu: cuneate nucleus.
Figure 4
Figure 4. Glutamatergic post-synaptic currents (EPSCs) elicited in identified DCN cells by stimulating the LVN in a sagittal slice.
(A) Photomicrograph of a DCN fusiform cell filled with lucifer yellow (top) and whole cell voltage clamp recording of this fusiform cell while stimulating the LVN (bottom). (B) Photomicrograph of a DCN granule cell filled with lucifer yellow (top) and whole cell voltage clamp recording of this granule cell while stimulating the LVN (bottom). Both cells were held at −68 mV and the LVN was stimulated at 0.3 Hz. Glutamatergic EPSCs are represented in black and are blocked by 50 µm D-AP5 and 10 µm NBQX (traces in red). Each trace represents an average of 10–20 single traces. The arrowhead represents the artifact of stimulus that has been removed for clarity. Scale bar: (A) 50 µm, (B) 20 µm.
Figure 5
Figure 5. Expression of VGLUT-1 and VGLUT-2 in the DCN and the VCN.
(A) Photomicrographs of VGLUT-1 and VGLUT-2 staining in the DCN with the layers being individually labelled (ML molecular layer, FL fusiform layer, DL deep layer). The overlay shows that VGLUT-1 is mainly present in the ML whereas VGLUT-2 is mainly present in the DL. (C) (B). Photomicrographs of VGLUT-1 and VGLUT-2 staining in the VCN. The overlay shows that VGLUT-1 is mainly expressed in the VCN in comparison to VGLUT-2. Scale bar: 200 µm. All slices are 20 µm thick. (C) Histograms representing the fluorescence intensity of VGLUT-1 and VGLUT-2 in the DCN layers, the MCD and the shell region. * p<0.05, *** P<0.001, NS non significant. (D) Histograms representing the puncta density of VGLUT-1 and VGLUT-2 labelled terminals in the DCN layers, the MCD and the shell region, *** P<0.001. ML: molecular layer; FL: fusiform cell layer; DL: deep layer.
Figure 6
Figure 6. Projections from the LVN to the DCN do not co-label with VGLUT-1 and co-label with VGLUT-2.
(A) Dextran amine (DA) labelled terminals are shown in the DCN deep layer (left). VGLUT-1 labelling is shown in the same area (middle). The overlay (right) shows an absence of co-labelling between VGLUT-1 and DA labelled terminals. (B) DA labelled terminals are shown in the DCN deep layer (left). VGLUT-2 labelling is shown in the same area (middle). The overlay (right) shows that the DA labelled terminals co-label with VGLUT-2. Scale bar 10 µm.
Figure 7
Figure 7. VGLUT-2 immunoreactivity increases after acoustic overexposure (AOE) triggering hearing deficit.
(A) Auditory brainstem response (ABR) recordings are elicited by a tone pip of 24 kHz and 94 dB SPL. The top traces show ABRs obtained at day 0 in a control subject and prior to AOE. The bottom traces show ABRs obtained at day 5 in both subjects. After AOE, the ABR is characterised by a flat trace and wave I (shown by the dotted line) is absent. (B) Summary plot representing the ABR threshold shifts between day 0 and day 5 in response to the tone pip frequency. * p<0.05. (C) Expression of VGLUT-1 (left) and VGLUT-2 (middle) in DCN coronal slices originating from a control subject (top) and after AOE (bottom). The overlay of VGLUT-1 and VGLUT-2 is shown in the right panels. (D) Histograms representing the fluorescence intensity of VGLUT-1 and VGLUT-2 in the DCN layers, the magnocellular domain of the VCN MCD and the shell region, *** P<0.001, NS non significant. ML: molecular layer; FL: fusiform cell layer; DL: deep layer. After AOE, the VGLUT-1 immunoreactivity decreases and the VGLUT-2 immunoreactivity increases in all DCN layers and the MCD. VGLUT-1 is decreased after AOE in the shell but VGLUT-2 expression was unaffected. (E) Examples of synaptic boutons originating from the LVN labelled with VGLUT-2 in control condition (left) and after AOE (middle). Note the presence of multiple VGLUT-2 labelled terminals after AOE. Results are summarised in the histogram (right). * p<0.05, Scale bar: (C) 100 µm, (E) 5 µm.

References

    1. Browner RH, Webster DB. Projections of the trapezoid body and the superior olivary complex of the Kangaroo rat (Dipodomys merriami). Brain Behav Evol. 1975;11:322–354. - PubMed
    1. Adams JC. Multipolar cells in the ventral cochlear nucleus project to the dorsal cochlear nucleus and the inferior colliculus. Neurosci Lett. 1983;37:205–208. - PubMed
    1. Snyder RL, Leake PA. Intrinsic connections within and between cochlear nucleus subdivisions in cat. J Comp Neurol. 1988;278:209–225. - PubMed
    1. Doucet JR, Ryugo DK. Projections from the ventral cochlear nucleus to the dorsal cochlear nucleus in rats. J Comp Neurol. 1997;385:245–264. - PubMed
    1. Babalian AL, Ryugo DK, Rouiller EM. Discharge properties of identified cochlear nucleus neurons and auditory nerve fibers in response to repetitive electrical stimulation of the auditory nerve. Exp Brain Res. 2003;153:452–460. - PubMed

Publication types

MeSH terms

Substances