

Increasing rates of vibriosis in the United States, 1996-2010: review of surveillance data from 2 systems
- PMID: 22572659
- PMCID: PMC4604744
- DOI: 10.1093/cid/cis243
Increasing rates of vibriosis in the United States, 1996-2010: review of surveillance data from 2 systems
Abstract
Background: The Centers for Disease Control and Prevention monitors vibriosis through 2 surveillance systems: the nationwide Cholera and Other Vibrio Illness Surveillance (COVIS) system and the 10-state Foodborne Diseases Active Surveillance Network (FoodNet). COVIS conducts passive surveillance and FoodNet conducts active surveillance for laboratory-confirmed Vibrio infections.
Methods: We summarized Vibrio infections (excluding toxigenic V. cholerae O1 and O139) reported to COVIS and FoodNet from 1996 through 2010. For each system, we calculated incidence rates using US Census Bureau population estimates for the surveillance area.
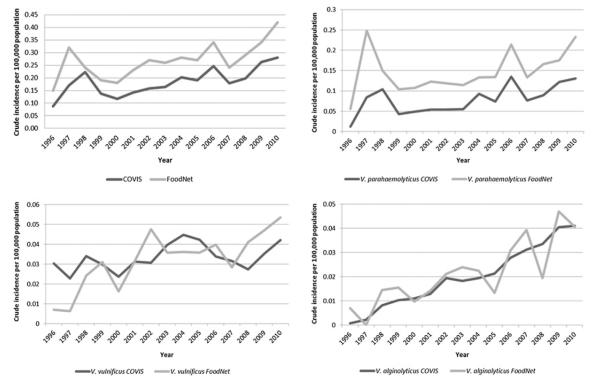
Results: From 1996 to 2010, 7700 cases of vibriosis were reported to COVIS and 1519 to FoodNet. Annual incidence of reported vibriosis per 100,000 population increased from 1996 to 2010 in both systems, from 0.09 to 0.28 in COVIS and from 0.15 to 0.42 in FoodNet. The 3 commonly reported Vibrio species were V. parahaemolyticus, V. vulnificus, and V. alginolyticus; both surveillance systems showed that the incidence of each increased. In both systems, most hospitalizations and deaths were caused by V. vulnificus infection, and most patients were white men. The number of cases peaked in the summer months.
Conclusions: Surveillance data from both COVIS and FoodNet indicate that the incidence of vibriosis increased from 1996 to 2010 overall and for each of the 3 most commonly reported species. Epidemiologic patterns were similar in both systems. Current prevention efforts have failed to prevent increasing rates of vibriosis; more effective efforts will be needed to decrease rates.
Figures
References
-
- Austin B. Vibrios as causal agents of zoonoses. Vet Microbiol. 2009;140:310–7. - PubMed
-
- Dechet AM, Yu PA, Koram N, Painter J. Nonfoodborne Vibrio infections: an important cause of morbidity and mortality in the United States, 1997–2006. Clin Infect Dis. 2008;46:970–6. - PubMed
-
- American Academy of Pediatrics . Other vibrio infections. In: Pickering LK, Baker C, Kimberlin DW, Long SS, editors. Red book: 2009 report of the committee on infectious diseases. 28th ed American Academy of Pediatrics; Elk Grove Village, IL: 2009. pp. 729–30.
-
- Horseman MA, Surani S. A comprehensive review of Vibrio vulnificus: an important cause of severe sepsis and skin and soft-tissue infection. Int J Infect Dis. 2010;15:e157–66. - PubMed
Publication types
MeSH terms
Grants and funding
LinkOut - more resources
Full Text Sources
Medical
