. 2012 Aug;108(4):1186-98.
doi: 10.1152/jn.00778.2011. Epub 2012 May 9.

Intrinsic and synaptic properties of vertical cells of the mouse dorsal cochlear nucleus

Affiliations

Intrinsic and synaptic properties of vertical cells of the mouse dorsal cochlear nucleus

Sidney P Kuo et al. J Neurophysiol. 2012 Aug.

Abstract

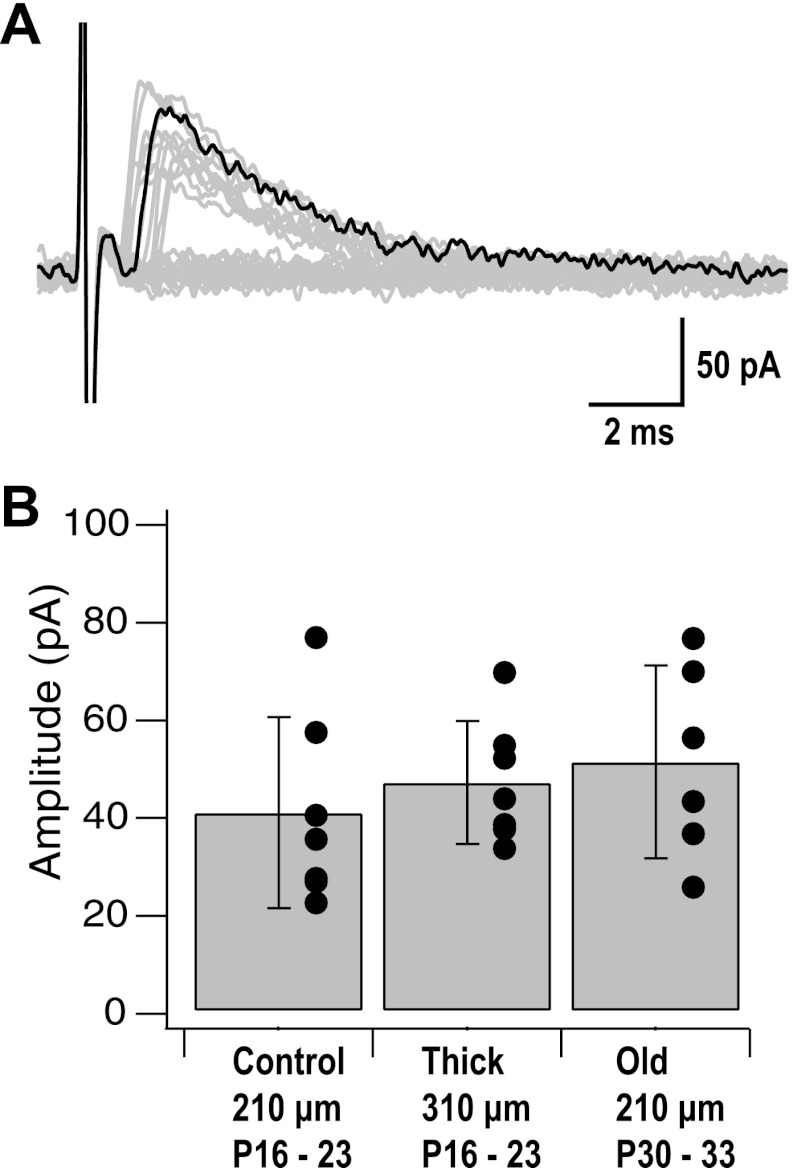
Multiple classes of inhibitory interneurons shape the activity of principal neurons of the dorsal cochlear nucleus (DCN), a primary target of auditory nerve fibers in the mammalian brain stem. Feedforward inhibition mediated by glycinergic vertical cells (also termed tuberculoventral or corn cells) is thought to contribute importantly to the sound-evoked response properties of principal neurons, but the cellular and synaptic properties that determine how vertical cells function are unclear. We used transgenic mice in which glycinergic neurons express green fluorescent protein (GFP) to target vertical cells for whole cell patch-clamp recordings in acute slices of DCN. We found that vertical cells express diverse intrinsic spiking properties and could fire action potentials at high, sustained spiking rates. Using paired recordings, we directly examined synapses made by vertical cells onto fusiform cells, a primary DCN principal cell type. Vertical cell synapses produced unexpectedly small-amplitude unitary currents in fusiform cells, and additional experiments indicated that multiple vertical cells must be simultaneously active to inhibit fusiform cell spike output. Paired recordings also revealed that a major source of inhibition to vertical cells comes from other vertical cells.


Figures

Fig. 1.
Fig. 1.
Vertical cells express green fluorescent protein (GFP) in GlyT2-EGFP transgenic mice. A: confocal z-projection (maximum-intensity projection of 50.4 μm in z-axis, images acquired at 0.4-μm intervals) of fixed coronal slice from a GlyT2-EGFP mouse in which cells were filled with biocytin. GFP fluorescence is in cyan. Biocytin labeling is in magenta. One fusiform cell (top left), 1 cartwheel cell (bottom left), and 2 vertical cells (bottom right) were filled with biocytin. The basal dendrites of the labeled fusiform cell and axon of the cartwheel cell were truncated in this slice. Prior to recordings, the labeled cartwheel cell and vertical cells exhibited strong GFP fluorescence (intensity of the GFP signal decreased during the vertical cell recordings, perhaps because of diffusion of the pipette solution into the cells). The fusiform cell did not express GFP. Most of the GFP-expressing (GFP+) cells in the deep layer are likely vertical cells. Most medium-sized cells within the superficial molecular layer and fusiform cell layer are likely cartwheel cells, with Golgi cells also probably labeled. Small cells in the outermost region of the molecular layer are mostly stellate cells. B: enlarged negative image of red fluorescence channel from boxed region in A. Note the round somatic morphology and smooth, relatively unbranched dendrites, which were typical of vertical cells. C: example voltage trace from a GFP+ deep-layer neuron (different cell than shown in B) from the beginning of the response to a 50-pA, 200-ms-long current injection. Note the biphasic afterhyperpolarizations following the spikes. Resting membrane potential (Vrest) −68 mV. D: averaged spontaneous excitatory postsynaptic current (EPSC) recorded at −70.2 mV from a GFP+ deep-layer neuron (average from 133 events occurring during 1 min of recording). Different cell than in B or C.
Fig. 2.
Fig. 2.
Heterogeneous spiking responses in vertical cells. A–D: example responses to hyperpolarizing (−250 pA, gray trace) and depolarizing (+500 pA, black trace) current injections (200-ms duration, see D, bottom) in cells classified as “rebound spiking” (A; 66/122 recorded vertical cells), Vrest = −67 mV, “plateau and rebound spiking” (B; 30/122), Vrest = −71 mV, “plateau” (C; 11/122), Vrest = −77 mV, or “no plateau or rebound spiking” (D; 15/122), Vrest = −73 mV.
Fig. 3.
Fig. 3.
Input-output relationships in vertical cells. A: instantaneous spike frequencies between consecutive action potentials (APs) during 200-ms depolarizing current injections from +50 pA (bottom line) to +650 pA (top line) (50-pA increments). Current injection started at time 0 on the x-axis. This cell was a “rebound spiking” neuron and was near the lower end of the observed range for mean spike frequencies elicited by depolarizing current injections. B: same as in A but for a cell that was near the upper end of the range for mean spike frequencies in response to current injection. This cell was a “plateau and rebound spiking” neuron. C: summary of mean frequencies for spikes occurring within the 200-ms duration of different levels of current injections. Symbols and error bars show mean ± SD of mean spike frequencies for “rebound spiking” (○, n = 21), “plateau and rebound spiking” (□, n = 12), “plateau” (◊, n = 7) and “no plateau or rebound spiking” (△, n = 9) cells. Lines are Hill function fits to the mean values for each subtype. Maximal firing rates (Fmax), half-saturation values (I1/2), and the exponent (n) from the fits (±SD) were Fmax = 582.48 ± 49.8, I1/2 = 339.18 ± 46.3, n = 1.43 ± 0.098 for “rebound spiking”; Fmax = 572.56 ± 129, I1/2 = 239.31 ± 96.5, n = 1.36 ± 0.45 for “plateau and rebound spiking”; Fmax = 520.9 ± 151, I1/2 = 275.64 ± 107, n = 1.79 ± 0.63 for “plateau”; and Fmax = 547.67 ± 89.2, I1/2 = 315.68 ± 66.7, n = 1.97 ± 0.42 for “no plateau or rebound spiking” cells.
Fig. 4.
Fig. 4.
Sustained spike rates in vertical cells. A–D: plots of instantaneous spike frequencies over the duration of 200-ms current steps at 300 pA. Connected lines represent spike frequency measurements for individual cells. A: data from 21 “rebound spiking” cells. B: “plateau and rebound spiking” cells (n = 13). C: “plateau” cells (n = 7). D: “no plateau or rebound spiking” cells (n = 9). E: summary of adaptation index measurements (mean instantaneous spike frequency of last 20 ms divided by that of first 20 ms of 200-ms step) for different vertical cell subtypes (symbols as in A–D) from data shown in A–D. Filled gray symbols show means ± SD. F: plot of adaptation index vs. first instantaneous spike frequency for data in A–D.
Fig. 5.
Fig. 5.
Short-term depression of excitatory inputs to vertical cells. A: example EPSCs recorded from a vertical cell in response to stimulus trains applied to auditory fibers at different frequencies. B: summary of ratio of EPSC peak amplitudes [EPSC(n)] compared with the first stimulus-evoked EPSC (EPSC1) over the course of stimulus trains for 11 cells that exhibited depression of EPSC amplitudes (out of 12 recorded vertical cells). Symbols and error bars show means ± SD. C: EPSC10-to-EPSC1 ratios for 20-Hz and 200-Hz stimulus trains. Gray circles connected by lines show data from individual cells acquired at each stimulus frequency. Filled black circles and error bars show mean ± SD. P = 0.08, paired t-test. n.s., Not significant. All recordings for data in A–C were acquired with 50 μM D-APV, 0.5 μM strychnine, and 10 μM SR-95531 in the bath solutions.
Fig. 6.
Fig. 6.
Paired recordings between vertical cells and fusiform neurons. A: schematic of recording configuration. In 11 of 91 tested pairs, spiking in presynaptic vertical cells elicited detectable unitary inhibitory postsynaptic currents (uIPSCs) in postsynaptic fusiform neurons. B: example time-locked traces recorded simultaneously from a presynaptic vertical cell recorded in current-clamp mode (top, single sweep) and a postsynaptic fusiform cell held in voltage clamp at −60 mV (bottom; gray traces are 10 superimposed current sweeps, black trace is average of 20 sweeps). APs were elicited in the presynaptic vertical cell by 1-ms suprathreshold current injections applied 10 times at 100 Hz (15 s between trials). Presynaptic Vrest = −75 mV. C: ratios of peak uIPSC amplitudes recorded in postsynaptic fusiform cells for each presynaptic vertical cell AP in a 100-Hz train compared with the first AP. Gray lines are data from individual cells. Black circles with error bars are means ± SD (n = 7 pairs).
Fig. 7.
Fig. 7.
Paired recordings between vertical cells. A: schematic of recording configuration. Unidirectional connections were found in 15 of 36 tested pairs, and 1 pair was connected in both directions (reciprocal connection). In all but 1 pair, synapses were tested in both directions, yielding a connection probability of 23.9% (17 of 71 tested connections). B: example time-locked traces recorded simultaneously from a presynaptic vertical cell recorded in current-clamp mode (top, single sweep) and a postsynaptic vertical cell held in voltage clamp at −60 mV (bottom; gray traces are 10 superimposed current sweeps, black trace is average of the 10 individual sweeps). APs were elicited in the presynaptic vertical cell by 1-ms suprathreshold current injections applied 10 times at 100 Hz (15 s between trials). Presynaptic Vrest = −69 mV. C: ratios of peak uIPSC amplitudes recorded in postsynaptic cells for each presynaptic AP in a 100-Hz train compared with the first AP. Gray lines are data from individual cells. Black circles with error bars are means ± SD (n = 10 pairs).
Fig. 8.
Fig. 8.
Comparison of minimal stimulation-evoked IPSCs between different slice thicknesses and tissue ages. A: example traces of minimal-stimulation protocol-evoked IPSCs in a vertical cell in a 210-μm slice. Statistics for evoked IPSCs in this connection: 12 successes, 18 failures, 30 trials total. B: average peak amplitudes of the successful events obtained in control (40.66 ± 19.57 pA, n = 7), thick (46.84 ± 12.59 pA, n = 7), and old (51.07 ± 19.72 pA, n = 6) slices. Means are ± SD. No significant differences were found when comparing control vs. thick (P = 0.50, unpaired t-test) or old (P = 0.36, unpaired t-test) groups.
Fig. 9.
Fig. 9.
Effect of vertical cell-mediated inhibition on fusiform cell spike output. A and B: example traces from a simultaneous recording acquired from a synaptically connected vertical cell and fusiform cell pair (see inset) in which spikes were evoked by just-suprathreshold current injection (“test injections,” arrows) in the postsynaptic fusiform cell either when the presynaptic vertical cell was at resting membrane voltage (Vm) and did not fire spikes (control; example traces shown in A) or when a train of suprathreshold current steps (1 ms each) were applied to presynaptic vertical cells to elicit 50 APs at 100 Hz starting 50 ms prior to test current injections into the fusiform cell (vertical spiking; example traces in B). Sweeps with presynaptic vertical cell spiking were interleaved with control sweeps in which vertical cells were silent. Identical test injections into the postsynaptic fusiform cell were used for both conditions and were constant throughout the experiment. Presynaptic Vrest = −79 mV, postsynaptic Vrest = −67 mV. C: summary of paired recording experiments as shown in A and B. Spike probability values were determined for 25–30 trials in each condition and were calculated by dividing the number of observed spikes by the number of test injections. Gray circles connected by lines represent mean spike probabilities in individual pairs under the different experimental conditions. Black circles with error bars show means ± SD for all tested pairs (n = 6 pairs). D and E: example voltage traces in a fusiform cell (Vrest = −65 mV) in which just-suprathreshold current injections (arrows) were used to elicit spikes without (D) or with (E) extracellular stimulation of inhibitory fibers starting 10 ms prior to test injections. Inset between D and E shows recording configuration. Gray inset in E is expanded region of voltage trace showing first 4 extracellular stimuli and first intracellular current injection. Note small (∼2 mV) inhibitory postsynaptic potentials (IPSPs) following stimulus artifacts. Control and stimulus conditions were interleaved. F: summary of experiments as in D and E. For each cell, mean spike probabilities were determined from 30 sweeps in each condition (gray circles). Black circles with error bars are means ± SD for the 6 cells. For data shown in F, 3 cells were recorded with and 3 cells were recorded without SR-95531 (10 μM) in the bath solution. All recordings in A–F were acquired with D-APV (50 μM) and NBQX (10 μM) in the bath solutions. *P < 0.05, ***P < 0.0001.

References

    1. Alibardi L. Cytological characteristics of commissural and tuberculo-ventral neurons in the rat dorsal cochlear nucleus. Hear Res 216–217: 73–80, 2006 - PubMed
    1. Arenz A, Silver RA, Schaefer AT, Margrie TW. The contribution of single synapses to sensory representation in vivo. Science 321: 977–980, 2008 - PMC - PubMed
    1. Bagnall MW, McElvain LE, Faulstich M, du Lac S. Frequency-independent synaptic transmission supports a linear vestibular behavior. Neuron 60: 343–352, 2008 - PMC - PubMed
    1. Bagnall MW, Stevens RJ, du Lac S. Transgenic mouse lines subdivide medial vestibular nucleus neurons into discrete, neurochemically distinct populations. J Neurosci 27: 2318–2330, 2007 - PMC - PubMed
    1. Blackstad TW, Osen KK, Mugnaini E. Pyramidal neurones of the dorsal cochlear nucleus: a Golgi and computer reconstruction study in cat. Neuroscience 13: 827–854, 1984 - PubMed

Publication types

LinkOut - more resources