

Review
doi: 10.1038/nrn3170.
Deep molecular diversity of mammalian synapses: why it matters and how to measure it
Affiliations
- PMID: 22573027
- PMCID: PMC3670986
- DOI: 10.1038/nrn3170
Item in Clipboard
Review
Deep molecular diversity of mammalian synapses: why it matters and how to measure it
Nat Rev Neurosci.
.
Abstract
Pioneering studies in the middle of the twentieth century revealed substantial diversity among mammalian chemical synapses and led to a widely accepted classification of synapse type on the basis of neurotransmitter molecule identity. Subsequently, powerful new physiological, genetic and structural methods have enabled the discovery of much deeper functional and molecular diversity within each traditional neurotransmitter type. Today, this deep diversity continues to pose both daunting challenges and exciting new opportunities for neuroscience. Our growing understanding of deep synapse diversity may transform how we think about and study neural circuit development, structure and function.
Figures
Author’s Draft
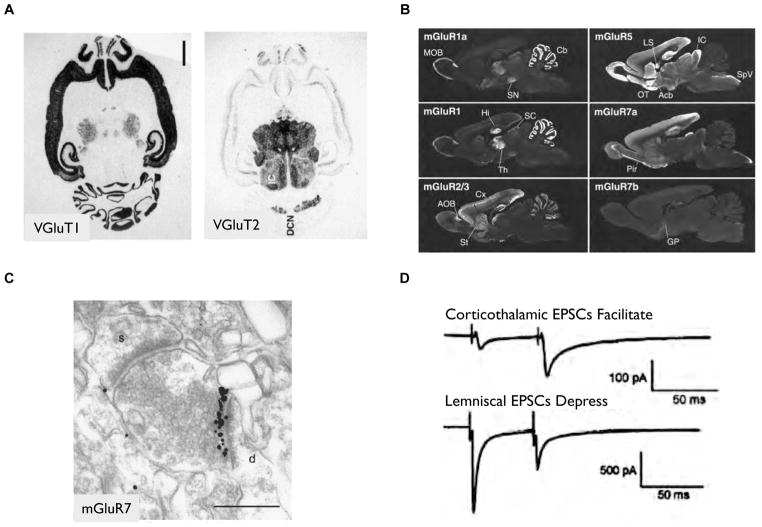
A) In situ hybridization studies using mRNA from the synaptic protein isoforms VGluT1 and VGluT2 reveal distinct regional gene expression of VGluT1 at high levels in the hippocampus, cerebral and cerebellar cortex and VGluT2 concentrated in the thalamus, brainstem and deep cerebellar nuclei . B–C) Immunohistochemistry studies using antibodies against metabotropic glutamate receptor isoforms reveal distinct expression patterns at both the regional level in the adult rat brain (B) and at the subcellular level (C) . In C), a CA1 hippocampal pyramidal cell axon forms two different synapses in CA3, one expressing mGluR7 (colloidal gold, ImmunoEM) with an interneuron and the other with a pyramidal cell that does not express mGluR7. D) Corticothalamic synapses exhibit paired-pulse facilitation, whereas corticolemniscal synapse show paired-pulse depression. differences between the two synapse types are likely to underlie the differences in physiological responses.
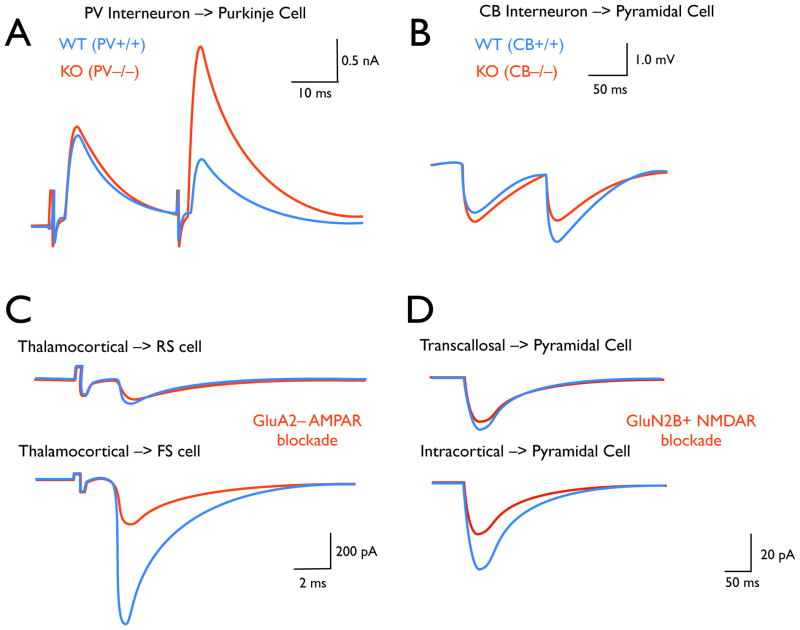
(A–B) Expression of different calcium binding proteins by two interneuron populations produces distinct transmission phenotypes. A) In mouse cerebellar slices, synapses between parvalbumin (PV) positive interneurons and purkinje cells exhibit paired-pulse depression (PPD) (WT: blue), but in knockout animals this connection exhibits paired-pulse facilitation (PPF) (KO: red, ). B) In neocortical slices, synapses between calbindin (CB) positive interneurons and pyramidal cells exhibit paired-pulse facilitation (PPF) (WT: blue), but in knockout animals, PPF is abolished (KO: red, ). (C–D) Selective receptor subtype expression is implicated in the ability of individual afferents to produce distinct responses in different post-synaptic cell-types, and of individual neurons to respond differently to distinct presynaptic inputs. C) In thalamocortical slices, the response of regular-spiking (RS) cells to thalamic stimulation is unaffected by pharmacological blockade of GluA2– AMPARS. However, the much more potent response of fast-spiking (FS) interneurons is significantly reduced. D) In neocortical slices, the response of layer 5 pyramids to longdistance transcallosal inputs is not affected by pharmacological blockade of GluN2B+ NMDARs. However, the response of these cells to local intracortical inputs is significantly reduced.
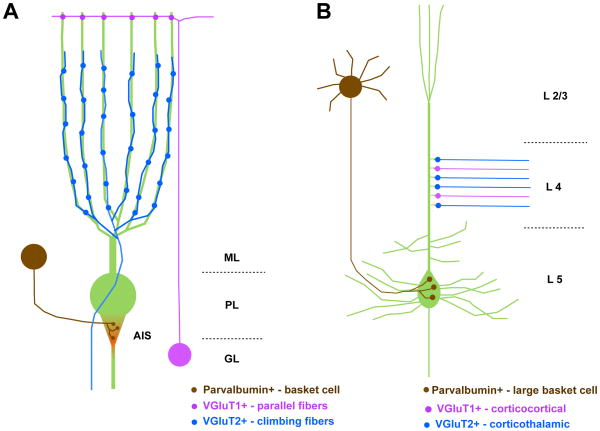
A) The axon initial segment (AIS) of a Purkinje neuron (green) in the cerebellum receives input from the PV+ synapses of a basket interneuron (brown). Neurofascin (red) is expressed in a gradient within the AIS during development and in the synaptic cleft of the mature synapses. Thus, PV and Neurofascin are part of the molecular signature of the pinceau synapse. Granule cell neurons (magenta) extend their axons, parallel fibers, to form VGluT1+ synapses on the distal dendrites of Purkinje cells. Climbing fibers extend from the inferior olive to innervate the proximal dendrites of Purkinje cells where they form VGluT2+ synapses. ML–molecular layer; PL-purkinje layer; GL-granule layer. B) The dendritic spines of a layer 5 (L5) pyramidal neuron (green) in the cerebral cortex are innervated by VGluT2+ synapses (blue) from thalamocortical axons and VGluT1+ synapses (magenta) from corticocortical axons in layer 4 (L4). The soma of the pyramidal neuron receives input from PV+ synapses (brown) formed by a basket cell from layer 2/3 (L2/3). The presence of these pre-synaptic markers can be used to help identify the pre-synaptic parent neurons that form individual synapses.
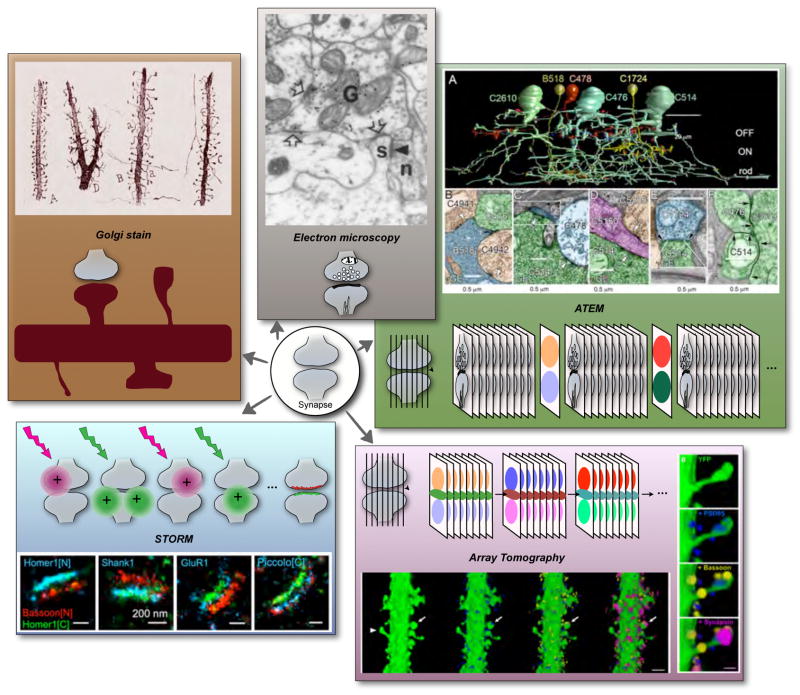
A) Golgi stain of cortical dendrites (drawing from Cajal ). Entire neurons and their processes can be visualized with this method, which is based on precipitation of metallic salts within random sparse subsets of cells within brain tissue. B) GABA immunogold staining of a synapse in rat cortex . Immunoelectron microscopy reveals the ultrastructural distribution of proteins using antibodies conjugated to gold particles or other electron-dense reagents. C) ATEM, Ca, a reconstructed fragment of the mammalian AII amacrine cell network with Cb, electron micrographs of synaptic connections. ATEM is based on automated EM imaging of large series of ultrathin sections. Molecular information is obtained from periodically intercalated sections that are immunolabeled and imaged with light microscopy. D) Array tomography (reconstruction of a segment of cortical dendrite with synaptic markers associated with dendritic spines) . This method is based on ultrathin serial sectioning, and multiple rounds of immunofluorescent labeling, imaging and antibody elution providing three-dimensional high-resolution molecular information. E) STORM (mapping of synaptic proteins onto a common coordinate system defined by Homer 1 and Bassoon ). This super resolution method is based on single-molecule imaging of photoswitchable fluorescent probes.
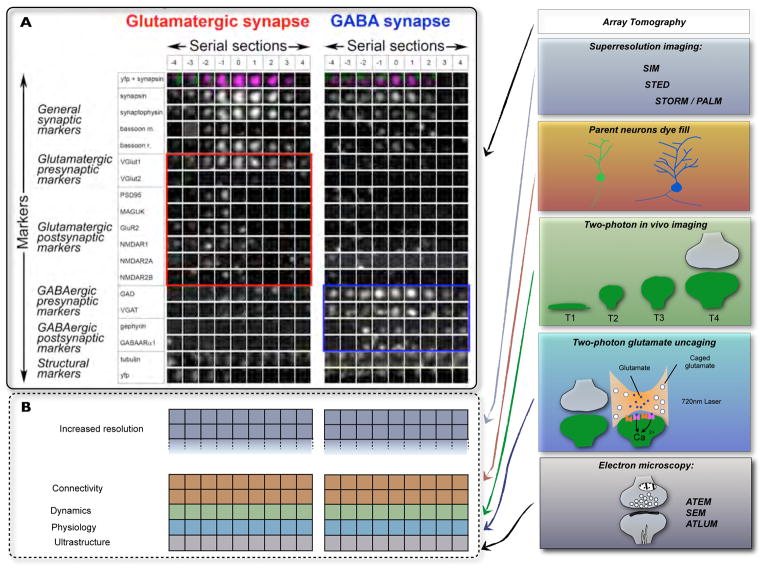
A) High dimensional proteomic data of individual synapses can be currently generated using array tomography. Such data are viewed as “synaptograms” with columns representing individual serial sections through a synapse and rows representing each marker. The two synaptograms show examples of a glutamatergic and GABAergic synapse with glutamatergic markers boxed in red and GABAergic markers boxed in blue, respectively. B) Array tomography is compatible with super-resolution imaging methods – that increase the resolution of array tomography data, as well as with intracellular dye fills , two-photon in vivo imaging –, two-photon glutamate uncaging and high throughput EM –, . In combination with these other methods, array tomography can be utilized to explore multiple facets of synaptic diversity.
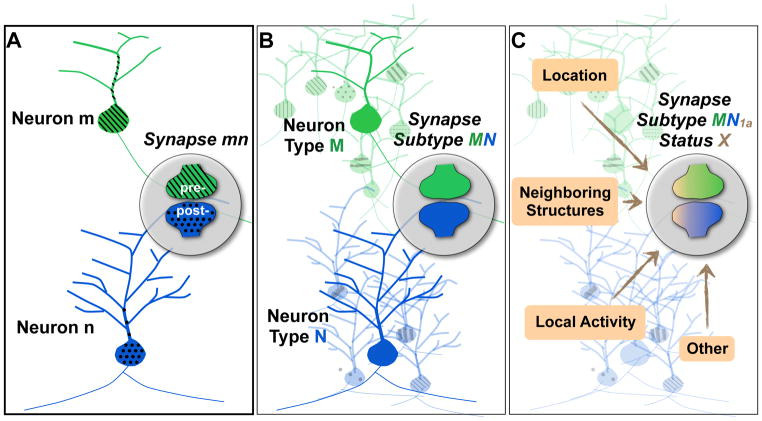
A) Such a classification scheme would be based on the fact that the molecular composition of an individual synapse depends on the molecular composition of its parent neurons. B) The cell types of the parent neurons M and N would then provide the basic definition of a generic synapse subtype MN. C) Specific local factors may more precisely define synapse type MN1a and also affect temporally varying status X within the subtype.
References
-
- Ramon y Cajal S. The structure and connections of neurons (Lecture delivered 1906) Elsevier Publishing Company; Amsterdam-London-New York: 1967.
-
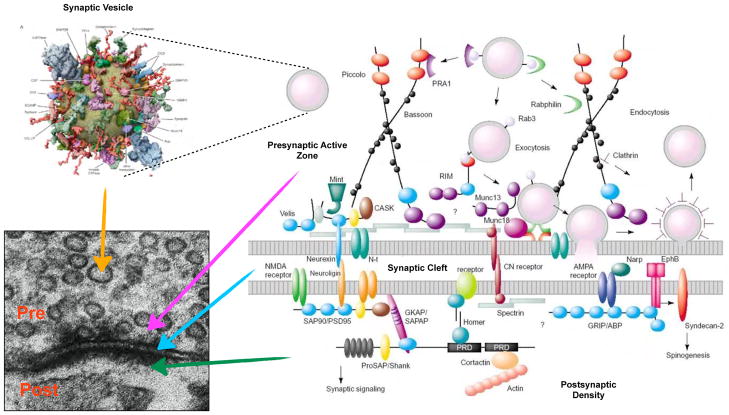
- Takamori S, et al. Molecular anatomy of a trafficking organelle. Cell. 2006;127:831–46. A comprehensive study of the protein and lipid composition of synaptic vesicles that culminates in the construction of a detailed structural model of the molecular architecture of these organelles and highlights their molecular complexity. - PubMed
-
- McPherson PS. Proteomic analysis of clathrin-coated vesicles. Proteomics. 2010;10:4025–39. - PubMed
-
- Collins MO, et al. Molecular characterization and comparison of the components and multiprotein complexes in the postsynaptic proteome. Journal of neurochemistry. 2006;97 (Suppl 1):16–23. - PubMed
Publication types
MeSH terms
Grants and funding
LinkOut - more resources
Full Text Sources
