

Human apolipoprotein E4 targeted replacement in mice reveals increased susceptibility to sleep disruption and intermittent hypoxia
- PMID: 22573105
- PMCID: PMC3404642
- DOI: 10.1152/ajpregu.00025.2012
Human apolipoprotein E4 targeted replacement in mice reveals increased susceptibility to sleep disruption and intermittent hypoxia
Abstract
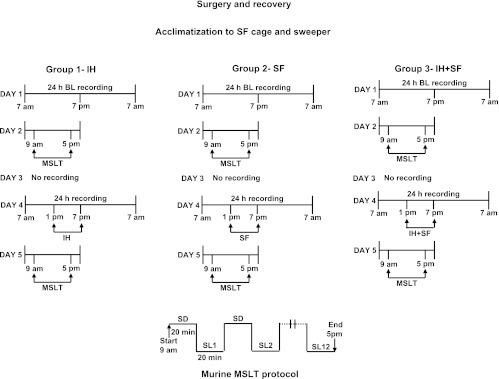
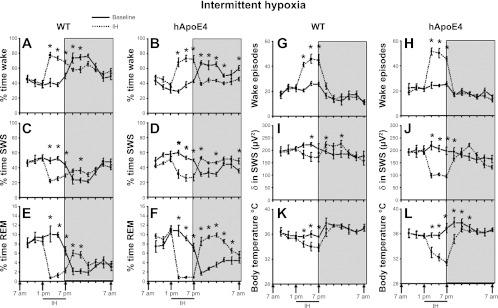
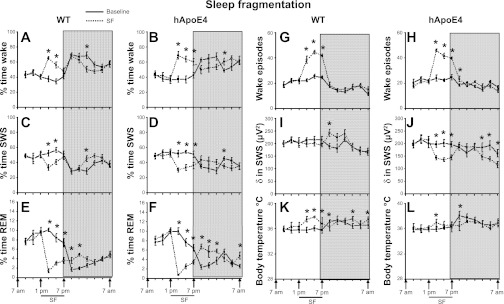
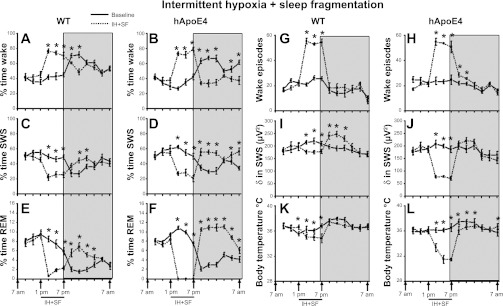
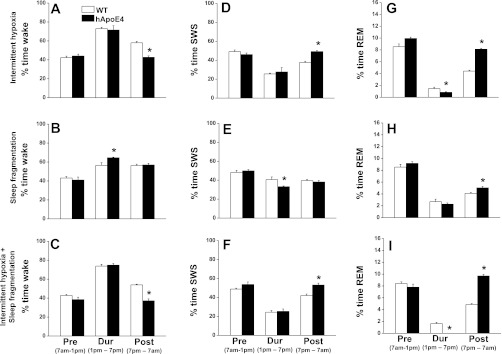
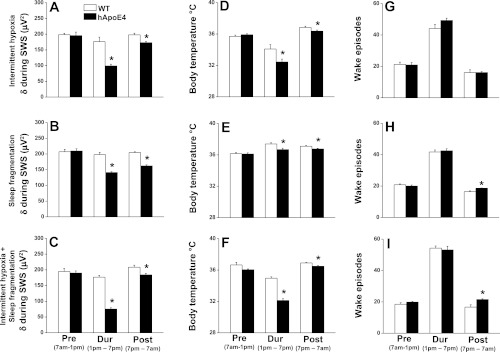
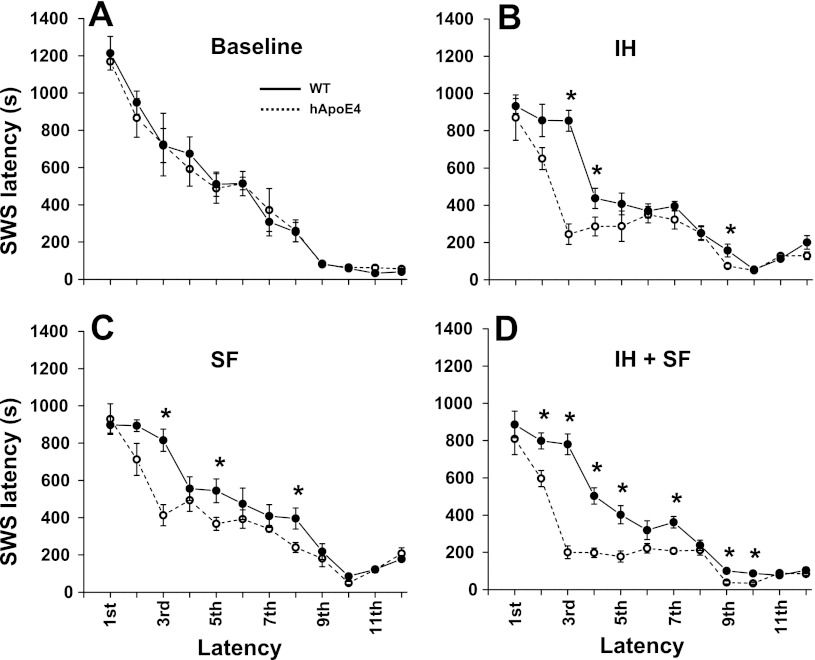
Intermittent hypoxia (IH) and sleep fragmentation (SF) are major manifestations of sleep apnea, a frequent condition in aging humans. Sleep perturbations are frequent in Alzheimer's disease (AD) and may underlie the progression of disease. We hypothesized that acute short-term IH, SF, and their combination (IH+SF) may reveal unique susceptibility in sleep integrity in a murine model of AD. The effects of acute IH, SF, and IH+SF on sleep architecture, delta power, sleep latency, and core body temperature were assessed in adult male human ApoE4-targeted replacement mice (hApoE4) and wild-type (WT) controls. Slow wave sleep (SWS) was significantly reduced, and rapid eye movement (REM) sleep was almost abolished during acute exposure to IH alone and IH+SF for 6 h in hApoE4, with milder effects in WT controls. Decreased delta power during SWS did not show postexposure rebound in hApoE4 unlike WT controls. IH and IH+SF induced hypothermia, which was more prominent in hApoE4 than WT controls. Mice subjected to SF also showed sleep deficits but without hypothermia. hApoE4 mice, unlike WT controls, exhibited increased sleep propensity, especially following IH and IH+SF, suggesting limited ability for sleep recovery in hApoE4 mice. These findings substantiate the potential impact of IH and SF in modulating sleep architecture and sleep homeostasis including maintenance of body temperature. Furthermore, the increased susceptibility and limited recovery ability of hApoE4 mice to sleep apnea suggests that early recognition and treatment of the latter in AD patients may restrict the progression and clinical manifestations of this frequent neurodegenerative disorder.
Figures
Similar articles
-
Intermittent hypoxia causes REM sleep deficits and decreases EEG delta power in NREM sleep in the C57BL/6J mouse.Sleep Med. 2006 Jan;7(1):7-16. doi: 10.1016/j.sleep.2005.06.006. Epub 2005 Nov 23. Sleep Med. 2006. PMID: 16309961
-
Chronic Intermittent Hypoxia Induces Robust Astrogliosis in an Alzheimer's Disease-Relevant Mouse Model.Neuroscience. 2019 Feb 1;398:55-63. doi: 10.1016/j.neuroscience.2018.11.040. Epub 2018 Dec 7. Neuroscience. 2019. PMID: 30529693 Free PMC article.
-
Fecal microbiota transplantation from mice exposed to chronic intermittent hypoxia elicits sleep disturbances in naïve mice.Exp Neurol. 2020 Dec;334:113439. doi: 10.1016/j.expneurol.2020.113439. Epub 2020 Aug 22. Exp Neurol. 2020. PMID: 32835671 Free PMC article. Review.
-
Sustained sleep fragmentation induces sleep homeostasis in mice.Sleep. 2015 Apr 1;38(4):567-79. doi: 10.5665/sleep.4572. Sleep. 2015. PMID: 25325477 Free PMC article.
-
Nocturnal sleep architecture in idiopathic hypersomnia: a systematic review and meta-analysis.Sleep Med. 2018 May;45:17-24. doi: 10.1016/j.sleep.2017.10.005. Epub 2017 Nov 2. Sleep Med. 2018. PMID: 29680423 Free PMC article.
Cited by
-
CrossTalk proposal: the intermittent hypoxia attending severe obstructive sleep apnoea does lead to alterations in brain structure and function.J Physiol. 2013 Jan 15;591(2):379-81. doi: 10.1113/jphysiol.2012.241216. J Physiol. 2013. PMID: 23322286 Free PMC article. No abstract available.
-
Genotype-phenotype interactions in pediatric obstructive sleep apnea.Respir Physiol Neurobiol. 2013 Nov 1;189(2):338-43. doi: 10.1016/j.resp.2013.03.016. Epub 2013 Apr 3. Respir Physiol Neurobiol. 2013. PMID: 23563156 Free PMC article. Review.
-
Solriamfetol improves chronic sleep fragmentation-induced increases in sleep propensity and ameliorates explicit memory in male mice.Sleep. 2023 May 10;46(5):zsad057. doi: 10.1093/sleep/zsad057. Sleep. 2023. PMID: 36866452 Free PMC article.
-
Intermittent hypoxia exacerbates pancreatic β-cell dysfunction in a mouse model of diabetes mellitus.Sleep. 2013 Dec 1;36(12):1849-58. doi: 10.5665/sleep.3214. Sleep. 2013. PMID: 24293759 Free PMC article.
-
Obstructive Sleep Apnea - Influence on the Cardiovascular System and Cognition.Laryngorhinootologie. 2023 May;102(S 01):S101-S114. doi: 10.1055/a-1963-9957. Epub 2023 May 2. Laryngorhinootologie. 2023. PMID: 37130534 Free PMC article.
References
-
- Baum L, Chen L, Ng HK, Pang CP. Apolipoprotein E isoforms in Alzheimer's disease pathology and etiology. Microsc Res Tech 50: 278–281, 2000 - PubMed
-
- Bliwise DL, Tinklenberg J, Yesavage JA, Davies H, Pursley AM, Petta DE, Widrow L, Guilleminault C, Zarcone VP, Dement WC. REM latency in Alzheimer's disease. Biol Psychiatry 25: 320–328, 1989 - PubMed
-
- Buttini M, Akeefe H, Lin C, Mahley RW, Pitas RE, Wyss-Coray T, Mucke L. Dominant negative effects of apolipoprotein E4 revealed in transgenic models of neurodegenerative disease. Neuroscience 97: 207–210, 2000 - PubMed
Publication types
MeSH terms
Substances
Grants and funding
LinkOut - more resources
Full Text Sources
Medical