. 2012 Jul 20;287(30):25353-60.
doi: 10.1074/jbc.M112.349126. Epub 2012 May 9.

Live imaging reveals differing roles of macrophages and neutrophils during zebrafish tail fin regeneration

Affiliations

Live imaging reveals differing roles of macrophages and neutrophils during zebrafish tail fin regeneration

Li Li et al. J Biol Chem. .

Abstract

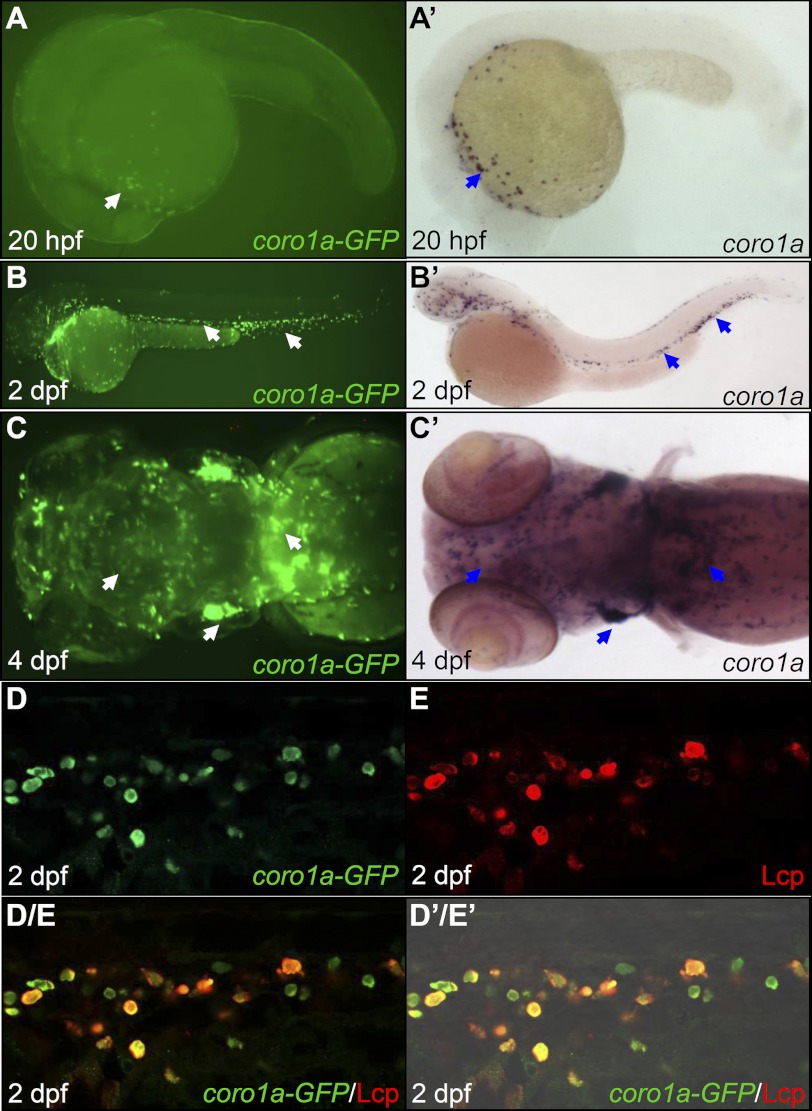
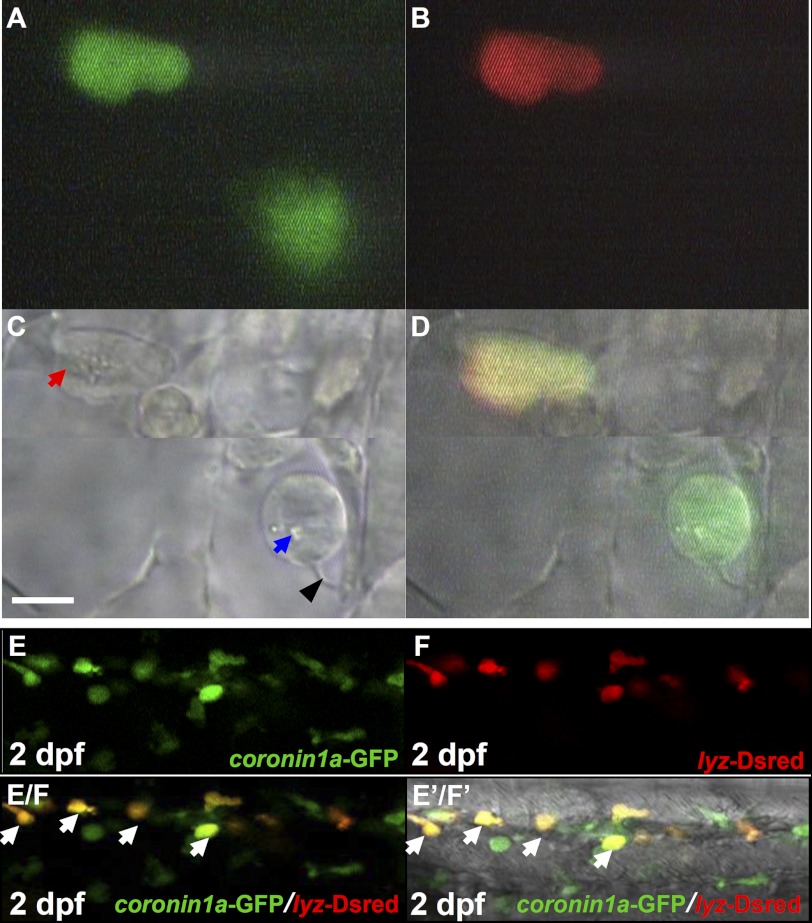
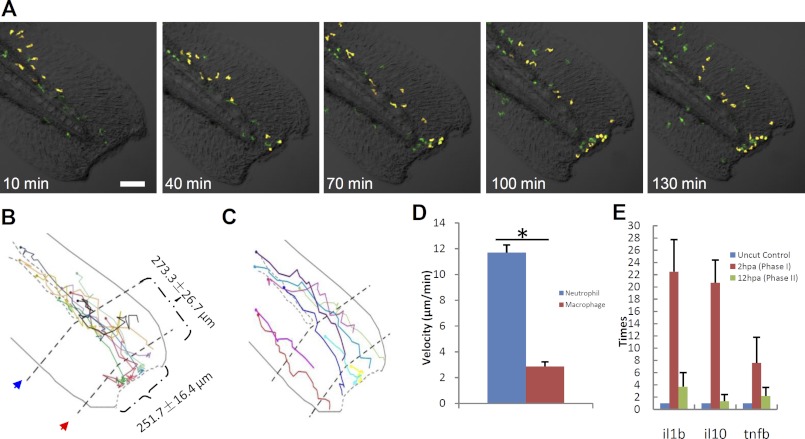
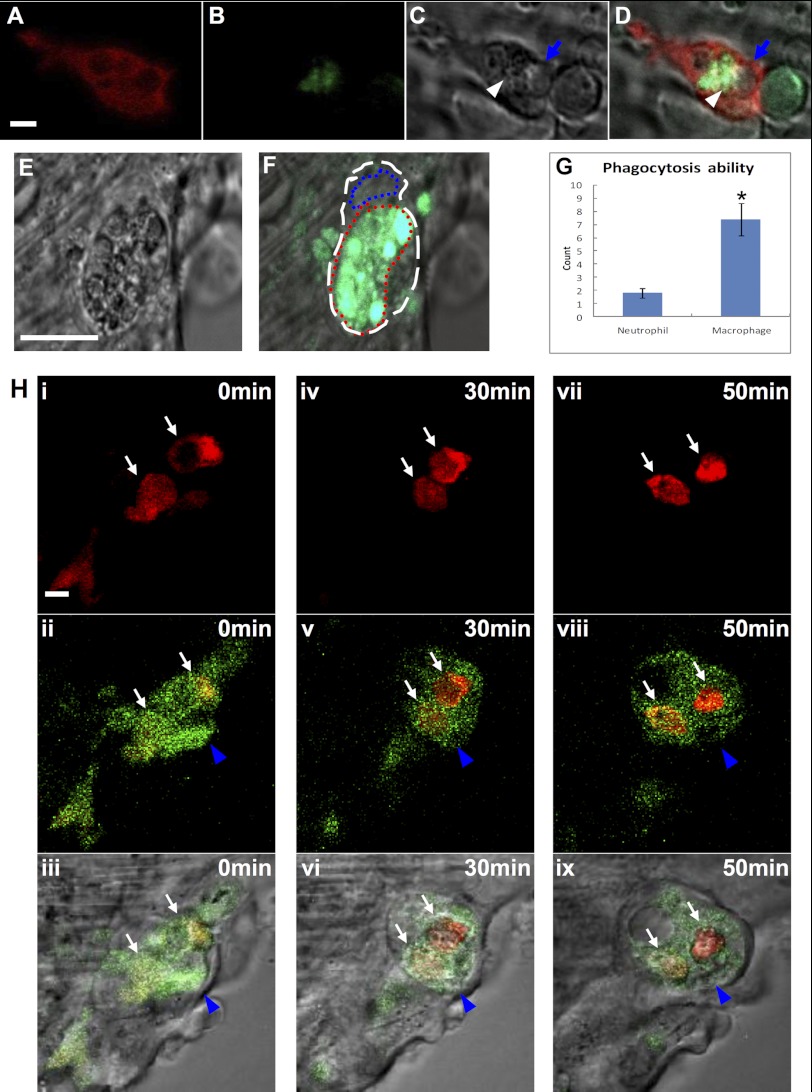
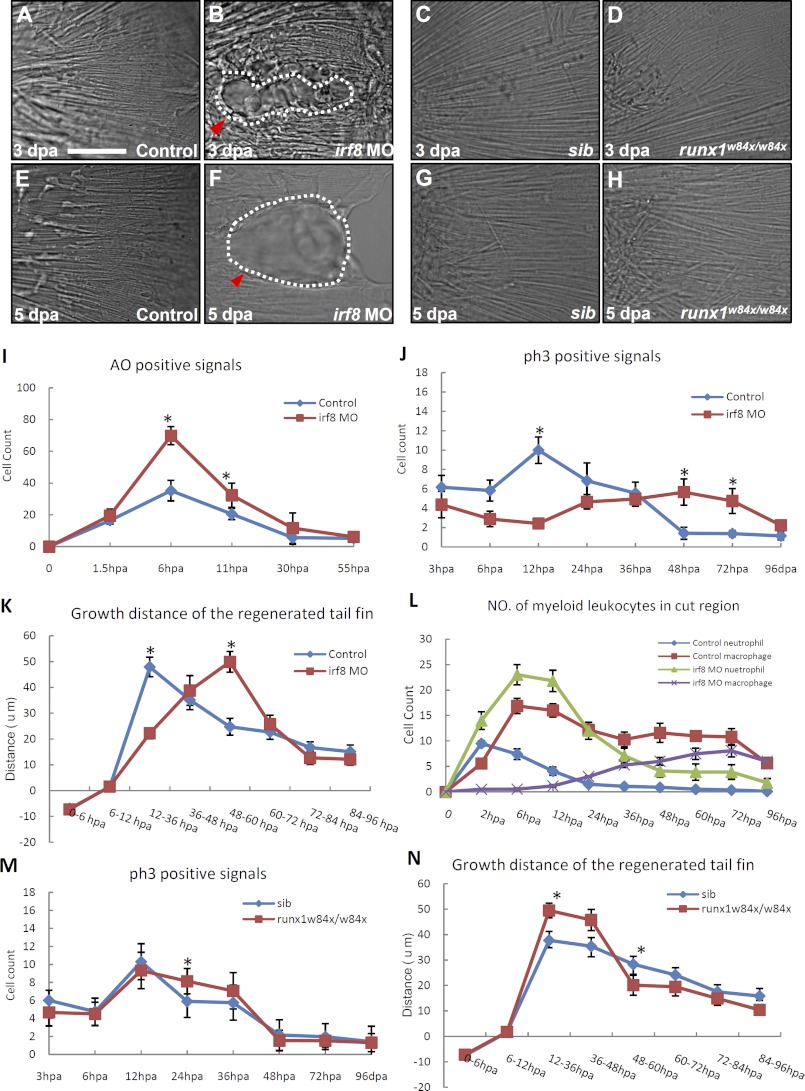
Macrophages and neutrophils are the pivotal immune phagocytes that enter the wound after tissue injury to remove the cell debris and invaded microorganisms, which presumably facilitate the regrowth of injured tissues. Taking advantage of the regeneration abilities of zebrafish and the newly generated leukocyte-specific zebrafish lines with labeling of both leukocyte lineages, we assessed the behaviors and functions of neutrophils and macrophages during tail fin regeneration. Live imaging showed that within 6 hours post amputation, the inflammatory stage, neutrophils were the primary cells scavenging apoptotic bodies and small cell debris, although they had limited phagocytic capacity and quickly underwent apoptosis. From 6 hours post amputation on, the resolution and regeneration stage, macrophages became the dominant scavengers, efficiently resolving inflammation and facilitating tissue remodeling and regrowth. Ablation of macrophages but not neutrophils severely impaired the inflammatory resolution and tissue regeneration, resulting in the formation of large vacuoles in the regenerated fins. In contrast, removal of neutrophils slightly accelerates the regrowth of injured fin. Our study documents the differing behaviors and functions of macrophages and neutrophils during tissue regeneration.


Figures

FIGURE 1.
FIGURE 1.
Tg(coro1a:eGFP) marks both macrophages and neutrophils. A–C, fluorescence imaging shows GFP signals in live Tg(coro1a:eGFP) embryos (n = 40/40) in the yolk sac at 20 hpf (A); in the AGM, the CHT, and the circulation at 2 dpf (B); and in the thymus, the kidney, and the brain at 4 dpf (C). A′–C′, WISH reveals coro1a RNA expression in the yolk sac at 20 hpf (n = 40/40) (A′); in the AGM, the CHT, and the circulation at 2 dpf (n = 40/40) (B′); and in the thymus, the kidney, and the brain at 4 dpf (n = 40/40) (C′). White arrows in A–C indicate the GPF+ cells, whereas blue arrows in A–C′ represent WISH signals. D and E, GFP and Lcp double antibody staining shows the co-localization of coro1a-GFP and Lcp in the CHT of 2 dpf Tg(coro1a:eGFP) embryos (n = 31/31). D/E, superimposed image of D and E. D/E′, merged view of D/E with the DIC image, AGM, aorta-gonad-mesonephros; CHT, caudal hematopoietic tissue.
FIGURE 2.
FIGURE 2.
Tg(coro1a:eGFP;lyz:Dsred) distinct macrophages and neutrophils. A–C, live imaging (×60) of two GFP+ cells in 2 dpf Tg(coro1a:eGFP;lyz:Dsred) embryos under a video-enhanced DIC microscope at the GFP channel (A), Dsred channel (B), and bright field (BF) channel (C) (n = 12/12). D, superimposed image of A, B, and C. The blue arrow and black arrowhead in C indicate the lysosome/phagosome inside the macrophage and the long filopodia of macrophage, respectively. The red arrow in C represents granules in neutrophils. Scale bar, 5 μm. E and F, confocal fluorescence imaging (×40) of the CHT region in 2 dpf Tg(coro1a:eGFP;lyz:Dsred) live embryos (n = 40/40) using the GFP (E) and Dsred channel (F), respectively. E/F, superimposed image of E and F. E/F′, merged view of E/F with the DIC image. White arrows in E/F and E/F′ represent yellow neutrophils resulting from the merge of GFP and Dsred.
FIGURE 3.
FIGURE 3.
Neutrophil and macrophage behavior upon fin transaction. A, frames of different time points following tail transaction in a 72 hpf Tg(coro1a:eGFP;lyz:Dsred) embryo (green, macrophages; yellow, neutrophils). Scale bar, 100 μm. B and C, schematic diagrams show the wound size and cell migration trajectory of the first 10 neutrophils (B) and nine macrophages (C) to arrive at the wound, followed for 5 h after tail transaction. The circle in the end of each trajectory line represents the initial site of each myeloid phagocyte. The red arrow indicates the first line near the cut edge, which is the end of the notochord, and the blue arrow represents the second line, which is the end of circulation. The dotted curved lines in B and C represent vessels. D, histogram reveals that the velocity of neutrophils is much faster than macrophages during the process toward the wound edge (n ≥ 9, mean ± S.E. (error bars)). *, statistical differences with corresponding control (t test, p < 0.05). E, histogram showing that the RNA level of cytokines increased dramatically in inflammatory stage but decreased thereafter until the regeneration stage (n = 42).
FIGURE 4.
FIGURE 4.
Macrophages and neutrophils behaviors in the wound after amputation. A–D, live imaging (×40) shows that lyz+ neutrophils engulf both AO+ particle cell debris and AO vacuolar cell debris at 2 hpa (n = 13). The white arrowhead and blue arrow indicate the AO+ particle and AO vacuolar cell debris, respectively. Scale bar, 1 μm. E and F, live imaging (×40) reveals a macrophage with a large amount of cell debris (E, n = 12), including AO+ particles (green) (F, n = 12). The white and blue dashed lines indicate the shape and the nucleus of macrophage, respectively, whereas the red dashed line manifests the large vacuole full of ingested debris. Scale bar, 10 μm. G, histogram reveals the phagocytosis ability (represented by the number of dead particles ingested) of macrophages and neutrophils (n = 12, mean ± S.E. (error bars)). The asterisk in G indicates statistical differences with corresponding control (t test, p < 0.05). H, frames (×100) of different time points of two neutrophils (indicated by white arrows) engulfed by a macrophage (represented by blue arrowheads) in a 72 hpf Tg(coro1a:eGFP;lyz:Dsred) embryo (n = 7). The bottom panels are merges of DIC with the middle panels. Scale bar, 1 μm.
FIGURE 5.
FIGURE 5.
Macrophages and neutrophils play different roles in the regeneration of tail fin. A–H, DIC images show the morphology of newly regenerated fin in 3 dpa control (n = 20/20) (A), 3 dpa irf8 morphants (n = 6/11) (B), 3 dpa siblings (sib) (n = 12/12) (C), 3 dpa runx1w84x mutant (n = 7/7) (D), 5 dpa control (n = 20/20) (E), 5 dpa irf8 morphants (n = 4/11) (F), 5 dpa siblings (n = 11/11) (G), and 5 dpa runx1w84x mutants (n = 6/6) (H). Scale bar, 50 μm. The white dashed lines in B and F indicate the outline of the vacuoles (red arrowheads). I, histogram reveals the number of pieces of AO+ cell debris at different time points after the transaction of tail fin in 72 hpf control (n ≥ 15, mean ± S.E. (error bars)) and irf8 morphants (n ≥ 16, mean ± S.E.) Tg(coro1a:eGFP;lyz:Dsred) embryos. J, histogram reveals the number of pH3+ cells at different time points after the transaction of tail fin in 72 hpf control (n ≥ 10, mean ± S.E.) and irf8 morphants (n ≥ 10, mean ± S.E.) Tg(coro1a:eGFP;lyz:Dsred) embryos. K, histogram quantifies the grow distance (μm) of regenerated fin at different stages after transaction in 72 hpf control (n ≥ 17, mean ± S.E.) and irf8 morphants (n ≥ 15, mean ± S.E.) Tg(coro1a:eGFP;lyz:Dsred) embryos. L, histogram reveals the number of myeloid phagocytes in the wound at different time points after transaction of tail fin in 72 hpf control (n ≥ 13, mean ± S.E.) and irf8 morphants (n ≥ 14, mean ± S.E.) Tg(coro1a:eGFP;lyz:Dsred) embryos. M, histogram reveals the number of pH3+ cells at different time points after the transaction of tail fin in 72 hpf sibling (n ≥ 11, mean ± S.E.) and runx1w84x mutant (n ≥ 6, mean ± S.E.) embryos. N, histogram quantifies the grow distance (μm) of regenerated fin at different stages after transaction in 72 hpf sibling (n ≥ 11, mean ± S.E.) and runx1w84x mutant (n ≥ 6, mean ± S.E.) embryos. The asterisks in I–K, M, and N indicate statistical differences with corresponding control (t test, p < 0.05).

References

    1. Poss K. D., Keating M. T., Nechiporuk A. (2003) Tales of regeneration in zebrafish. Dev. Dyn. 226, 202–210 - PubMed
    1. Medzhitov R. (2007) Recognition of microorganisms and activation of the immune response. Nature 449, 819–826 - PubMed
    1. Martin P., Leibovich S. J. (2005) Inflammatory cells during wound repair. The good, the bad, and the ugly. Trends Cell Biol. 15, 599–607 - PubMed
    1. Arnold L., Henry A., Poron F., Baba-Amer Y., van Rooijen N., Plonquet A., Gherardi R. K., Chazaud B. (2007) Inflammatory monocytes recruited after skeletal muscle injury switch into antiinflammatory macrophages to support myogenesis. J. Exp. Med. 204, 1057–1069 - PMC - PubMed
    1. Leibovich S. J., Ross R. (1975) The role of the macrophage in wound repair. A study with hydrocortisone and antimacrophage serum. Am. J. Pathol. 78, 71–100 - PMC - PubMed

Publication types

LinkOut - more resources