Comparative Study
. 2012 May 9;32(19):6651-64.
doi: 10.1523/JNEUROSCI.4876-11.2012.

Differential modulation of the oligodendrocyte transcriptome by sonic hedgehog and bone morphogenetic protein 4 via opposing effects on histone acetylation

Affiliations
Comparative Study

Differential modulation of the oligodendrocyte transcriptome by sonic hedgehog and bone morphogenetic protein 4 via opposing effects on histone acetylation

Muzhou Wu et al. J Neurosci. .

Abstract

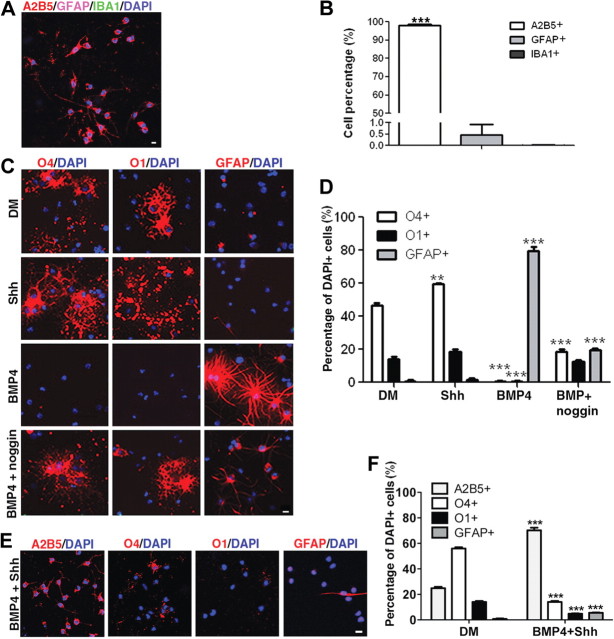
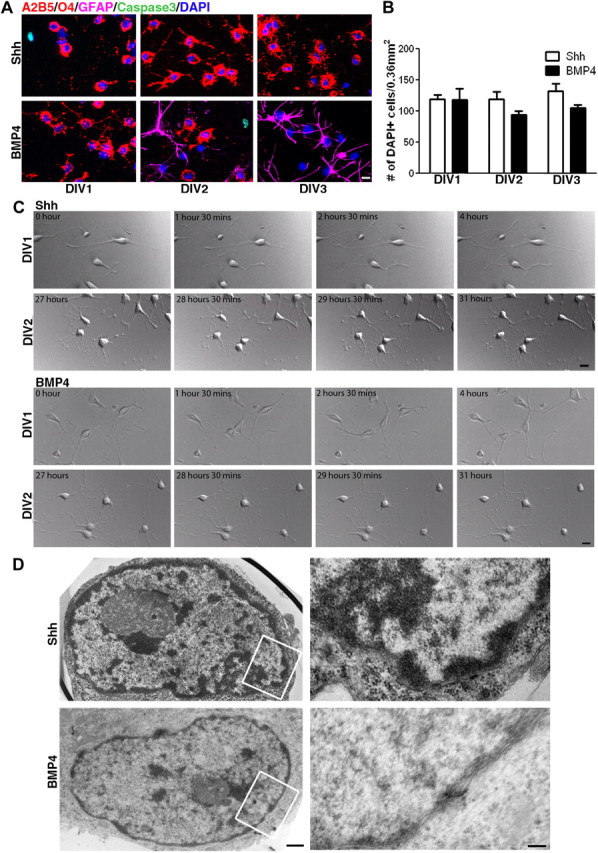
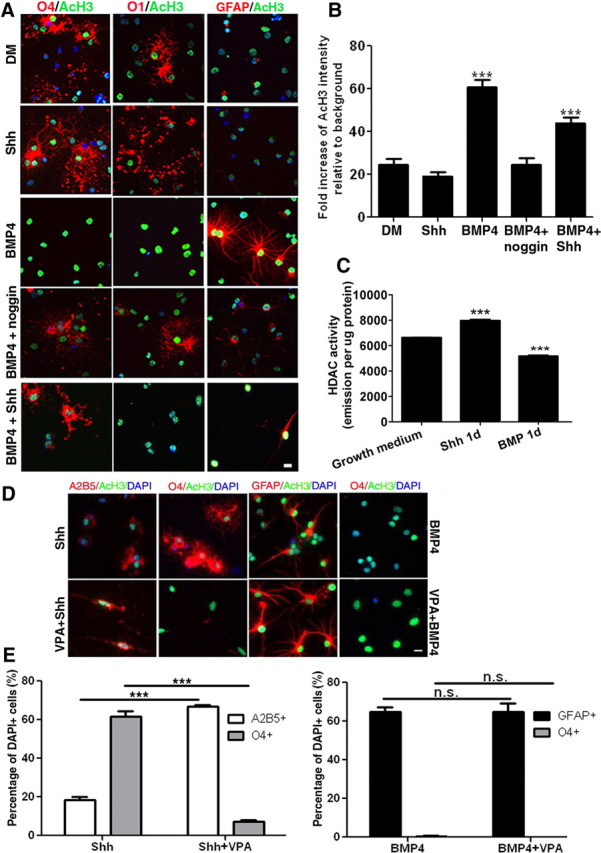
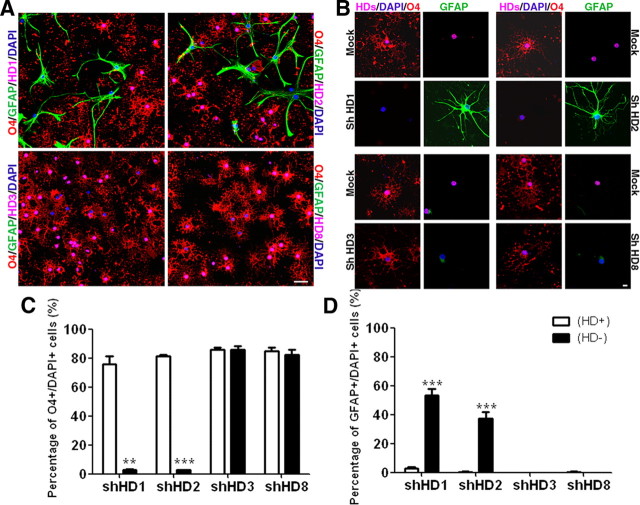
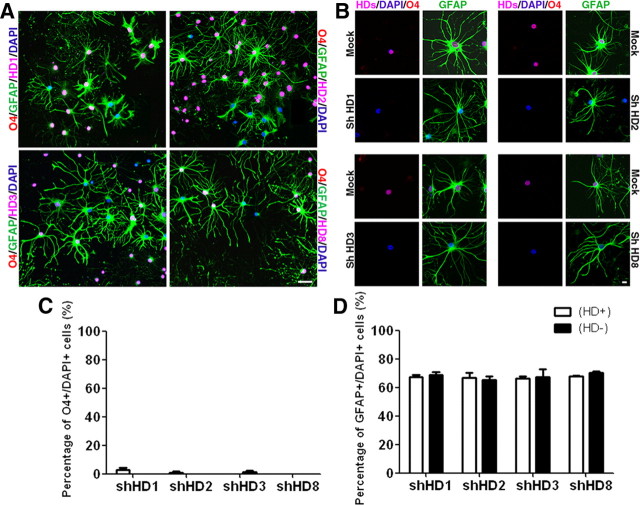
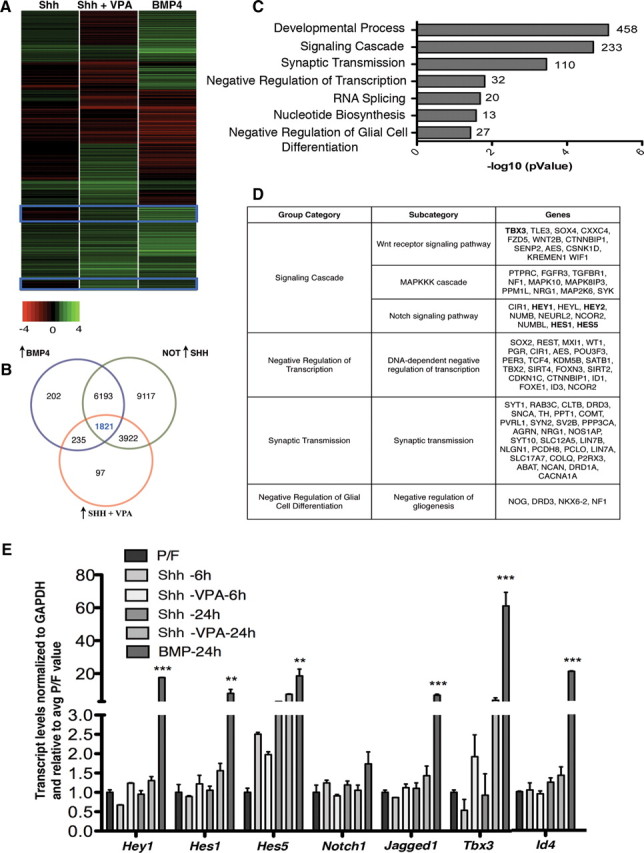
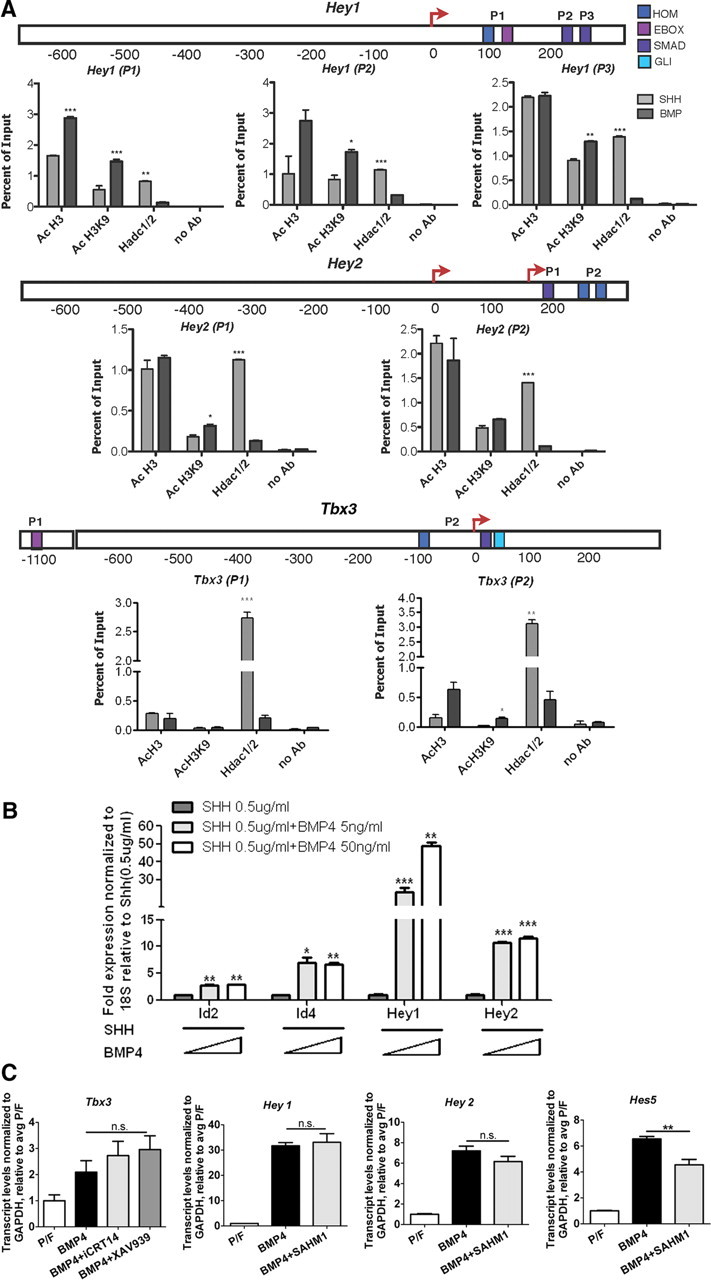
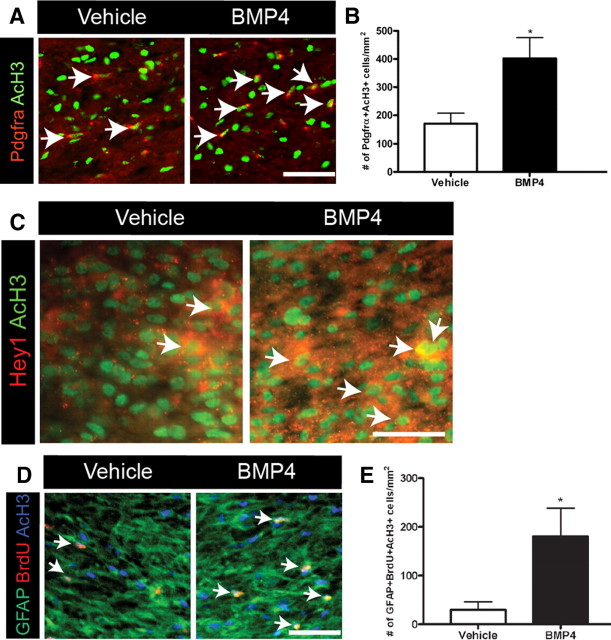
Differentiation of oligodendrocyte progenitor cells (OPCs) into mature oligodendrocytes is regulated by the interplay between extrinsic signals and intrinsic epigenetic determinants. In this study, we analyze the effect that the extracellular ligands sonic hedgehog (Shh) and bone morphogenetic protein 4 (BMP4), have on histone acetylation and gene expression in cultured OPCs. Shh treatment favored the progression toward oligodendrocytes by decreasing histone acetylation and inducing peripheral chromatin condensation. BMP4 treatment, in contrast, inhibited the progression toward oligodendrocytes and favored astrogliogenesis by favoring global histone acetylation and retaining euchromatin. Pharmacological treatment or silencing of histone deacetylase 1 (Hdac1) or histone deacetylase 2 (Hdac2) in OPCs did not affect BMP4-dependent astrogliogenesis, while it prevented Shh-induced oligodendrocyte differentiation and favored the expression of astrocytic genes. Transcriptional profiling of treated OPCs, revealed that BMP4-inhibition of oligodendrocyte differentiation was accompanied by increased levels of Wnt (Tbx3) and Notch-target genes (Jag1, Hes1, Hes5, Hey1, and Hey2), decreased recruitment of Hdac and increased histone acetylation at these loci. Similar upregulation of Notch-target genes and increased histone acetylation were observed in the corpus callosum of mice infused with BMP4 during cuprizone-induced demyelination. We conclude that Shh and Bmp4 differentially regulate histone acetylation and chromatin structure in OPCs and that BMP4 acts as a potent inducer of gene expression, including Notch and Wnt target genes, thereby enhancing the crosstalk among signaling pathways that are known to inhibit myelination and repair.


Figures

Figure 1.
Figure 1.
Shh and BMP4 play opposing roles in oligodendrocyte differentiation. A, Rat primary OPCs were immunoselected using magnetic beads and an antibody specific for the progenitor marker A2B5. B, The composition of the OPC culture was examined by immunostaining and counting the number of A2B5+ OPCs, GFAP+ astrocytes and IBA1+ microglial cells (***p < 0.001). C, Immunocytochemistry of OPCs cultured for 5 days in chemically defined medium alone (DM), or with sonic hedgehog (Shh 1 μg/ml), bone morphogenic protein 4 (BMP4 50 ng/ml), or with BMP4 and its antagonist Noggin (BMP4 50 ng/ml + Noggin 1 μg/ml) and stained with the O4 antibody to identify late progenitors, O1 to label galactocerebroside on mature oligodendrocytes and GFAP to label astrocytes. D, Bar graph represent the percentage of O4+, O1+ or GFAP+ cells relative to total DAPI+ nuclei. E, Immunocytochemistry of OPC cultures maintained for 5 days in medium containing both Shh (1 μg/ml) and BMP4 (50 ng/ml). F, Bar graphs indicate the percentage of A2B5+, O4+, O1+ or GFAP+ cells relative to the total number of DAPI+ nuclei. Scale bars: A, 10 μm; C, E, 20 μm.
Figure 2.
Figure 2.
Shh and BMP4 differentially modulate the morphology and chromatin structure of treated OPCs. A, Caspase-3 staining showed no selective cell death in distinct cell types in response to Bmp4 or Shh treatment. B, The bar graph shows the total number of DAPI+ cells counted in each well after 1, 2 or 3 days of Shh or BMP4 treatment. C, Morphological changes detected during a 4 h period of time-lapse imaging of OPC treated with either Shh or BMP4 for a 24 h (DIV1) or 48 h (DIV2) period. D, Electron microscopy of the nuclei of Shh and BMP4-treated cells. Note the electron-dense appearance of the Shh-treated cells, due to the formation of heterochromatin and the prevalence of euchromatin in BMP4-treated cells. Scale bars: A, C, 20 μm; D, left, 500 nm; right, 120 nm.
Figure 3.
Figure 3.
Shh and BMP4 have an opposing effect on nuclear histone acetylation. A, Immunocytochemistry of OPCs cultured for 5 days in chemically defined medium alone (DM), or with Shh (1 μg/ml), BMP4 (50 ng/ml), with BMP4 and Noggin (1 μg/ml) or with Shh and BMP4 together and stained with AcH3 (green) and the indicated lineage markers (red). DAPI (Blue) was used as nuclear counterstain. B, The intensity of AcH3 in each treatment was measured by ImageJ software and is expressed as fold intensity relative to background. (***p < 0.001). C, The bar graph indicates the total HDAC enzymatic activity measured in cell lysates from primary OPCs cultures treated with Shh (1 μg/ml) or BMP4 (50 ng/ml) for 1 day. OPCs cultures in chemically defined medium supplemented with PDGF and FGF (Growth Medium) were used as baseline control (***p < 0.001). D, Confocal image of primary OPCs pretreated with the HDAC inhibitor VPA (1 mm) before the 5 day treatment with Shh or BMP4 and then costained with antibodies for acetyl-histone 3 (AcH3, green), and for the cell lineage markers O4, A2B5, and GFAP to reveal cell identity. E, Bar graphs represent the A2B5+, O4+, or GFAP+ cell counts relative to total DAPI+ nuclei (***p < 0.001). Scale bars: A, D, 10 μm.
Figure 4.
Figure 4.
Hdac1 and Hdac 2 are necessary for Shh-induced oligodendrocyte lineage progression. Low (A) and high (B) magnification of immunoselected primary OPCs transduced with lentiviral vectors containing ShRNA to silence Hdac1, Hdac2, Hdac3 or Hdac8. Scrambled ShRNA lentiviral vectors were used as controls. OPCs were then treated with Shh (1 μg/ml) for 4 days and stained with antibodies specific for HDAC1, HDAC2, HDAC3 and HDAC8 to confirm silencing efficacy, and colabeled with O4 and anti-GFAP to test the effect on oligodendrocytic and astrocytic lineage respectively. C, D, Bar graphs show the percentage of O4+ (C) or GFAP+ (D) cells that were also HDAC-positive (white bars) or HDAC-negative (black bars; cell counts, 100–200 cells/condition from two independent biological replicates). Note that silencing Hdac1 or Hdac2 but not Hdac3 or Hdac8 isoforms, inhibited oligodendrocyte lineage progression, while promoting the expression of the astrocyte lineage marker GFAP (**p < 0.01, ***p < 0.001). Scale bars: A, 50 μm; B, 10 μm.
Figure 5.
Figure 5.
Silencing of Hdac isoforms has no effect on Bmp4-induced astrogliogenesis. Low (A) and high (B) magnification of immunoselected primary OPCs transduced with lentiviral vectors containing ShRNA to silence Hdac1, Hdac2, Hdac3 or Hdac8. Scrambled ShRNA lentiviral vectors were used as controls. OPCs were treated with Bmp4 (50 ng/ml) for 4 d and stained with antibodies specific for Hdac1, Hdac2, Hdac3, and Hdac8 (in red) to confirm silencing efficacy, and colabeled with O4 or anti-GFAP (green) to test the effect on oligodendrocytic and astrocytic lineage respectively. DAPI (blue) was used as nuclear counterstain. C, D, Bar graphs show the percentage of O4+ (C) or GFAP+ (D) cells that were also Hdac-positive (white bars) or Hdac-negative (black bars; cell counts, 100–200 cells/condition in two independent biological replicates). Note that silencing all four Hdac isoforms had no effect on Bmp4-induced astrogliogenesis. Scale bars: A, 50 μm; B, 10 μm.
Figure 6.
Figure 6.
Differential effect of Shh or BMP4 on the transcriptome of treated OPCs. A, Heat map representation of the microarray data obtained from OPCs treated with Shh, BMP4 or Shh with VPA for 24 h normalized to the control (P/F). B, Venn Diagram that illustrates the number of genes upregulated by BMP4, upregulated by Shh with VPA and not upregulated by Shh. The intersection for the three sets is highlighted. C, Representation of the most significant gene ontology terms that were enriched in the intersection set of the genes upregulated by BMP4, upregulated by Shh with VPA and not upregulated by Shh. D, The table shows representative enriched genes within the indicated ontology terms. E, Validation of the microarray data by quantitative real time PCR on RNA samples from OPCs treated with BMP4, Shh and Shh with VPA that shows the upregulation of Notch and Wnt target genes upon BMP4 treatment (P/F, proliferation medium; **p < 0.01, ***p < 0.001).
Figure 7.
Figure 7.
BMP4 regulates histone acetylation of Notch and Wnt target genes. A, Quantitative ChIP on chromatin samples isolated from cells treated with Shh or BMP4 for 24 h and immunoprecipitated with antibodies specific for pan acetyl H3 (AcH3), for acetyl K9 (AcH3K9) and for Hdac1 and Hdac2 (HDAC1/2). The schematics above each ChIP experiment indicate the regions of the Hey1, Hey2 and Tbx3 loci, the relative primer pairs (P1, P2, P3) used to test each regions and the relative location of the SMAD, Homeobox, GLI and E box binding sites (colored boxes). Values are expressed as the relative enrichment of the immunoprecipitated chromatin over input levels. B, OPCs were treated with constant dose of Shh (0.5 μg/ml) and increased doses of BMP4 (0 ng/ml, 5 ng/ml and 50 ng/ml) for 24 h, gene expressions were evaluated by real-time PCR (*p < 0.05, **p < 0.01, ***p < 0.001). C, Real- time PCR on RNA samples from the same cells either kept proliferating in the presence of PDGF and FGF (P/F) or pretreated with the Wnt (iCRT14, XAV939) or Notch inhibitors (SAHM1) and then exposed to BMP4 for 24 h. The bar graphs represent the average ± SEM of three independent determinations (*p < 0.05, **p < 0.01, ***p < 0.001).
Figure 8.
Figure 8.
BMP4 infusion increases numbers of OPCs and proliferating astrocytes with histone acetylation in the demyelinated corpus callosum. Mice were infused with either vehicle or BMP4 for 5 days beginning at 4 weeks of cuprizone. A, Immunostaining of PDGFRA (red) and AcH3 (green) in the demyelinated corpus callosum. Representative PDGFRA+AcH3+ double-positive cells are indicated by arrows. B, Bar graph shows the quantification of PDGFRA+AcH3+ double-positive cells per mm2 in the midline corpus callosum. C, In situ hybridization of Hey1 probe (red) and immunostaining of AcH3 (green) in the demyelinated corpus callosum. Representative Hey1+AcH3+ double-positive cells are indicated by arrows. D, Immunostaining of GFAP (green), BrdU (red) and AcH3 (blue) in the demyelinated corpus callosum. Representative GFAP+BrdU+AcH3+ triple-positive cells are indicated by arrows. E, Bar graph shows the quantification of GFAP+BrdU+AcH3+ triple-positive cells per mm2 in the midline corpus callosum. Data represent means ± SEM; (n = 3–4 mice, *p < 0.05). Scale bars: A, C, D, 50 μm.

Similar articles

Cited by

References

    1. Ara J, See J, Mamontov P, Hahn A, Bannerman P, Pleasure D, Grinspan JB. Bone morphogenetic proteins 4, 6, and 7 are up-regulated in mouse spinal cord during experimental autoimmune encephalomyelitis. J Neurosci Res. 2008;86:125–135. - PubMed
    1. Back SA, Craig A, Kayton RJ, Luo NL, Meshul CK, Allcock N, Fern R. Hypoxia-ischemia preferentially triggers glutamate depletion from oligodendroglia and axons in perinatal cerebral white matter. J Cereb Blood Flow Metab. 2007;27:334–347. - PubMed
    1. Baron W, Metz B, Bansal R, Hoekstra D, de Vries H. PDGF and FGF-2 signaling in oligodendrocyte progenitor cells: regulation of proliferation and differentiation by multiple intracellular signaling pathways. Mol Cell Neurosci. 2000;15:314–329. - PubMed
    1. Barres BA, Lazar MA, Raff MC. A novel role for thyroid hormone, glucocorticoids and retinoic acid in timing oligodendrocyte development. Development. 1994;120:1097–1108. - PubMed
    1. Behesti H, Holt JK, Sowden JC. The level of Bmp4 signaling is critical for the regulation of distinct T-box gene expression domains and growth along the dorso-ventral axis of the optic cup. BMC Dev Biol. 2006;6:62. - PMC - PubMed

Publication types

MeSH terms

LinkOut - more resources