. 2012 Jun;53(6):908-16.
doi: 10.2967/jnumed.111.100545. Epub 2012 May 9.

In vivo imaging of endogenous pancreatic β-cell mass in healthy and type 1 diabetic subjects using 18F-fluoropropyl-dihydrotetrabenazine and PET

Affiliations

In vivo imaging of endogenous pancreatic β-cell mass in healthy and type 1 diabetic subjects using 18F-fluoropropyl-dihydrotetrabenazine and PET

Marc D Normandin et al. J Nucl Med. 2012 Jun.

Abstract

The ability to noninvasively measure endogenous pancreatic β-cell mass (BCM) would accelerate research on the pathophysiology of diabetes and revolutionize the preclinical development of new treatments, the clinical assessment of therapeutic efficacy, and the early diagnosis and subsequent monitoring of disease progression. The vesicular monoamine transporter type 2 (VMAT2) is coexpressed with insulin in β-cells and represents a promising target for BCM imaging.

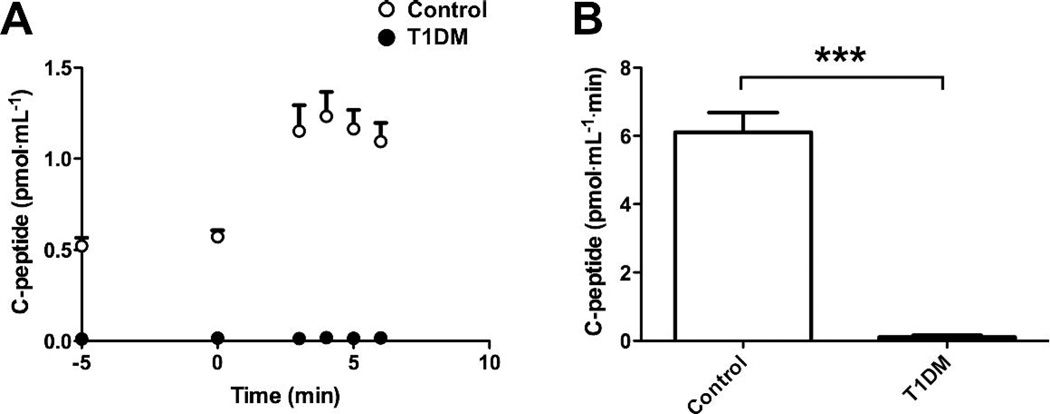
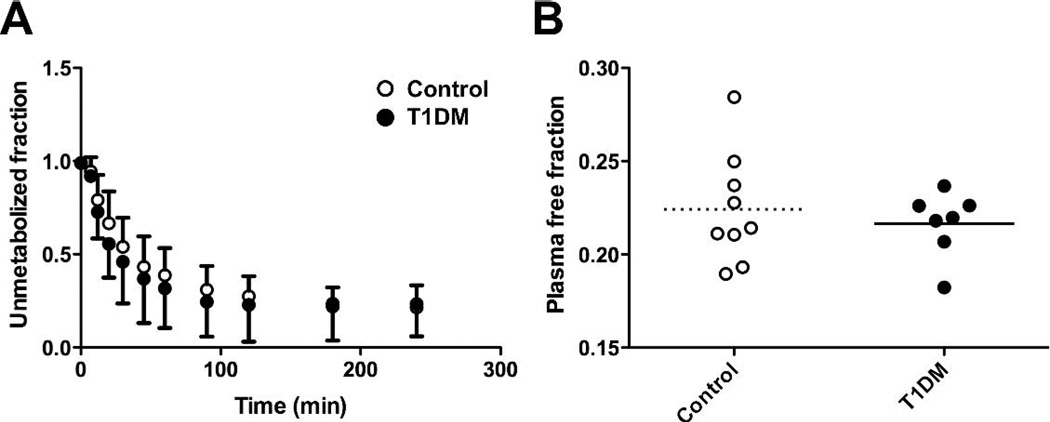
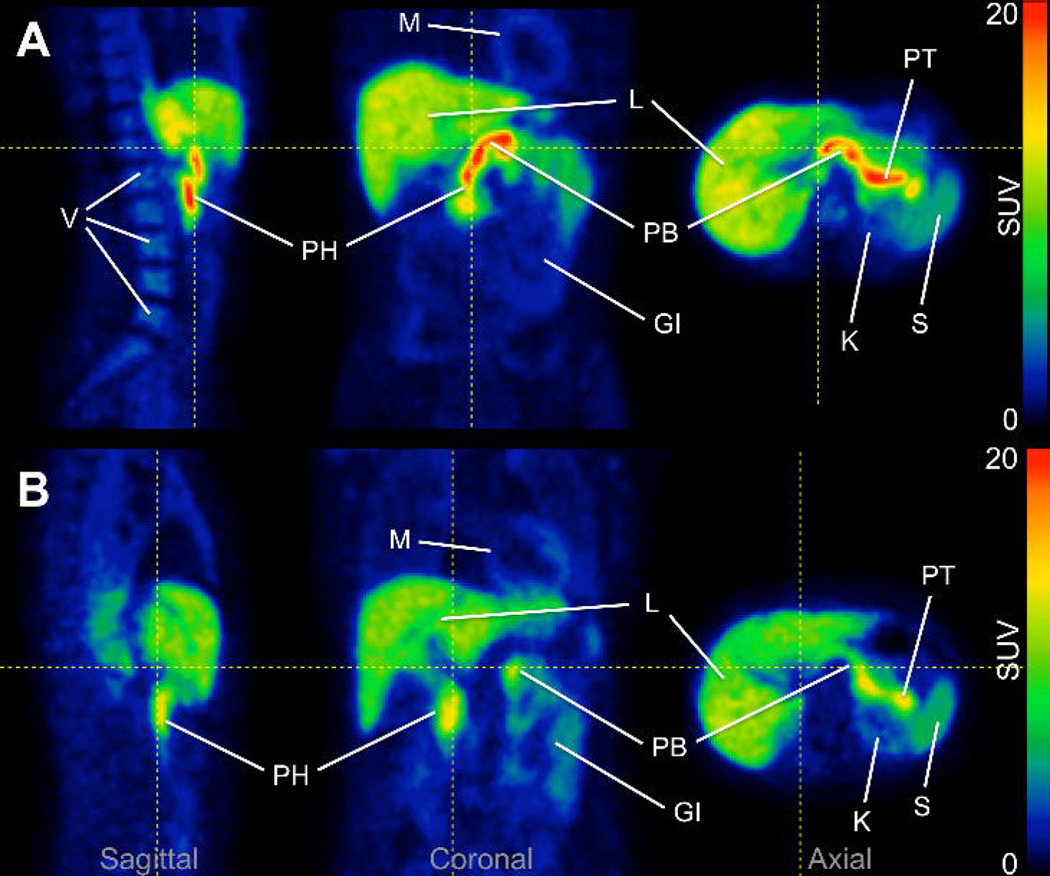
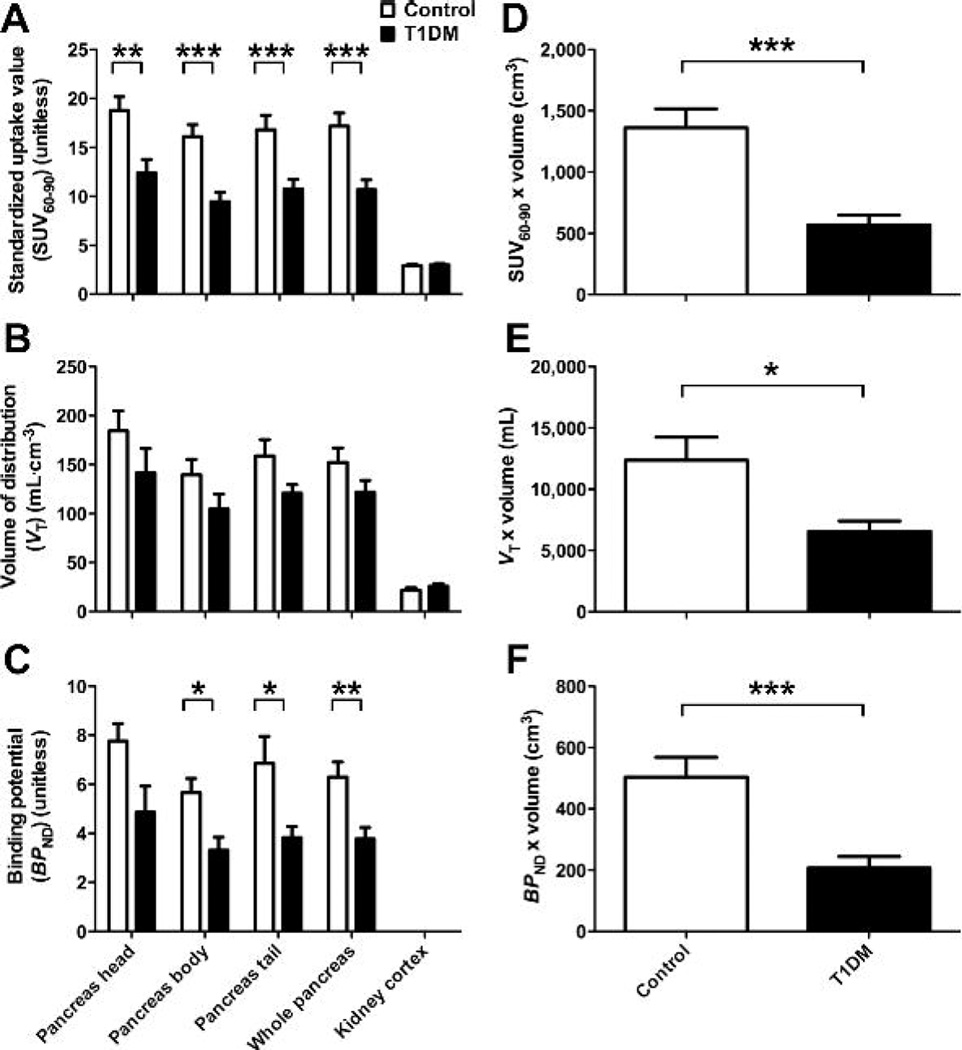
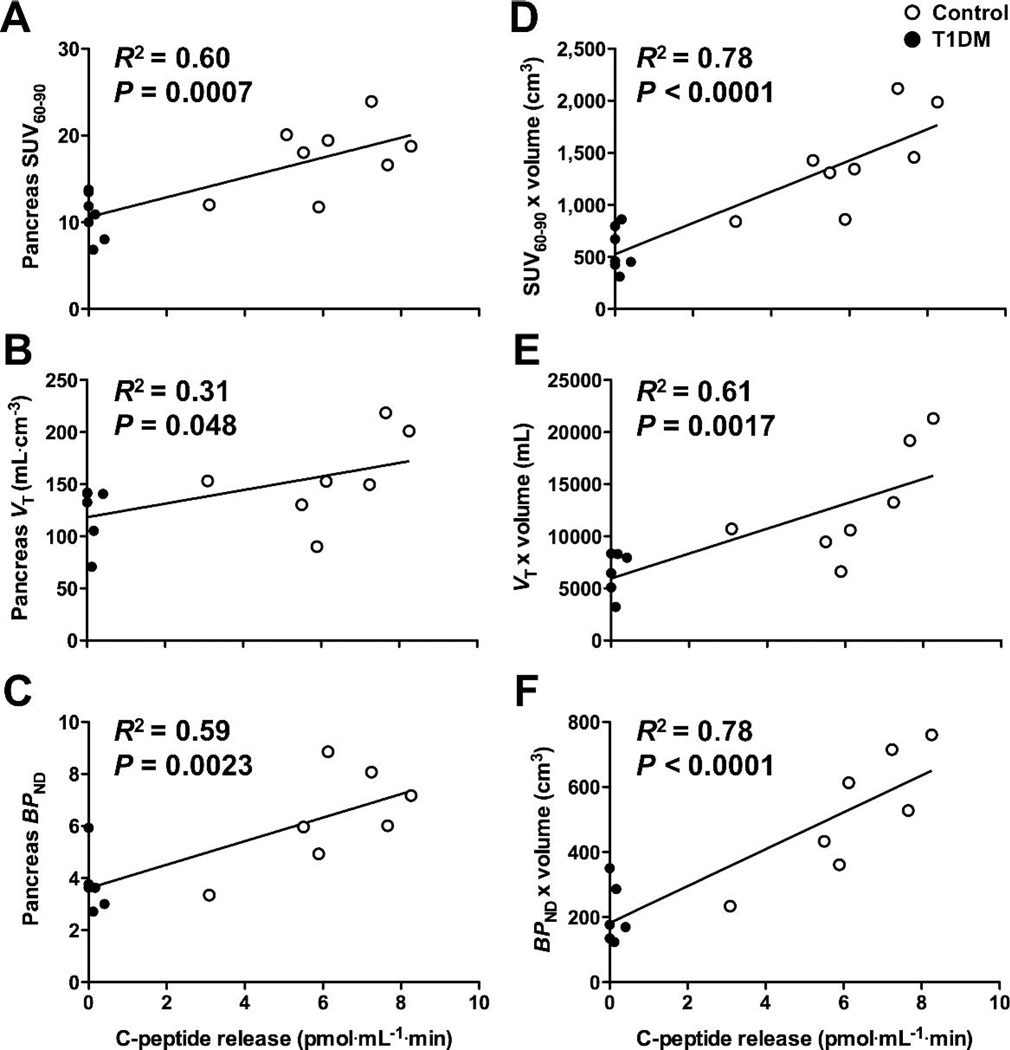
Methods: We evaluated the VMAT2 radiotracer (18)F-fluoropropyl-dihydrotetrabenazine ((18)F-FP-(+)-DTBZ, also known as (18)F-AV-133) for quantitative PET of BCM in healthy control subjects and patients with type 1 diabetes mellitus. Standardized uptake value was calculated as the net tracer uptake in the pancreas normalized by injected dose and body weight. Total volume of distribution, the equilibrium ratio of tracer concentration in tissue relative to plasma, was estimated by kinetic modeling with arterial input functions. Binding potential, the steady-state ratio of specific binding to nondisplaceable uptake, was calculated using the renal cortex as a reference tissue devoid of specific VMAT2 binding.

Results: Mean pancreatic standardized uptake value, total volume of distribution, and binding potential were reduced by 38%, 20%, and 40%, respectively, in type 1 diabetes mellitus. The radiotracer binding parameters correlated with insulin secretion capacity as determined by arginine-stimulus tests. Group differences and correlations with β-cell function were enhanced for total pancreas binding parameters that accounted for tracer binding density and organ volume.

Conclusion: These findings demonstrate that quantitative evaluation of islet β-cell density and aggregate BCM can be performed clinically with (18)F-FP-(+)-DTBZ PET.


Figures

Figure 1
Figure 1
C-peptide release as an indicator of β-cell function assessed by arginine stimulus test. (A) Circulating levels of C-peptide released in response to arginine administration were greater in control subjects (n=8) than diabetic patients (n=7), as were the areas under the curve (B). Data are expressed as mean ± s.e.m. Data from T1DM patients indicated by filled markers, control subjects by open markers. Error bars represent s.e.m. ** P<0.01, *** P<0.005.
Figure 2
Figure 2
Characteristics of [18F]FP-(+)-DTBZ metabolism and availability in arterial blood. (A) The fraction of radioactivity in plasma attributable to the parent compound was not statistically different between groups (0.23<P< 0.94 for t tests at each individual time point; P=0.36 for two-way ANOVA across time points common to all subjects). Data are expressed as mean ± s.d. (B) Fraction of radiotracer unbound to plasma proteins did not differ between groups (0.224±0.030 vs. 0.217±0.018, P=0.53). Horizontal lines represent mean for the respective cohort. Open markers: control subjects. Filled markers: T1DM patients.
Figure 3
Figure 3
Representative [18F]FP-(+)-DTBZ PET images. (A) Image acquired in a healthy control subject showed high uptake of tracer in pancreas. (B) Pancreas uptake was reduced in a type 1 diabetes patient. Both images represent PET data summed from 0 to 90 min post-injection and are displayed on a common scale (0 to 20 SUV, i.e., radioactivity normalized by injected dose and body weight). PT: pancreas tail, PB: pancreas body, PH: pancreas head, L: liver, K: kidney, S: spleen, M: myocardium, V: vertebrae, GI: gastrointestinal tract. Images for entire cohort are displayed in Supplemental Figure 2. Maximum intensity projection animations are shown in the Supplemental Videos 1–16.
Figure 4
Figure 4
[18F]FP-(+)-DTBZ binding was reduced in T1DM patients vs. healthy control subjects. (A) Standardized uptake value (SUV60–90 the concentration of tracer from 60–90 minutes normalized by injected dose and body weight, was significantly lower by 38% in pancreas of T1DM patients (n=7) as compared to controls (n=9). No significant difference in kidney SUV60–90 was observed. (B) Volume of distribution (VT), which reflects the total uptake and retention of tracer relative to arterial plasma, was estimated in subjects for whom arterial blood was measured (n=8 control, n=6 T1DM). VT was reduced by 20% in the pancreas of T1DM subjects at trend level significance. VT in kidney cortex did not differ between groups. (C) Binding potential (BPND), which reflects tracer specific binding using kidney VT as an estimate of non-displaceable uptake, was significantly lower by 40% in the pancreas of T1 DM patients than healthy subjects. (D–F) Group differences in PET binding parameters estimated from whole pancreas are accentuated after correction for pancreas volume, which provides a measure of total tracer binding reflecting aggregate β-cell mass. Control subjects are designated by open bars, T1DM patients by filled bars. Data are expressed as mean ± s.e.m. * P<0.05, ** P<0.01, *** P<0.005.
Figure 5
Figure 5
Tracer binding density was associated with insulin secretory capacity. The pancreatic [18F]FP-(+)-DTBZ uptake and binding density parameters SUV (A), VT (B) and BPND (C) correlated positively with arginine-stimulated increases in circulating C-peptide, a metric of β-cell function. Multiplying [18F]FP-(+)-DTBZ binding density parameters by pancreas volume to reflect total pancreatic binding improved their quantitative relationships with insulin secretory capacity (D–F). Data from T1DM patients indicated by filled markers, control subjects by open markers.

References

    1. Schmitz A, Shiue CY, Feng Q, et al. Synthesis and evaluation of fluorine-18 labeled glyburide analogs as beta-cell imaging agents. Nucl Med Biol. 2004;31:483–491. - PubMed
    1. Schneider S, Feilen PJ, Schreckenberger M, et al. In vitro and in vivo evaluation of novel glibenclamide derivatives as imaging agents for the non-invasive assessment of the pancreatic islet cell mass in animals and humans. Exp Clin Endocrinol Diabetes. 2005;113:388–395. - PubMed
    1. Wangler B, Beck C, Shiue CY, et al. Synthesis and in vitro evaluation of (S)-2-([11 C]methoxy)-4-[3-methyl-1 -(2-piperidine-1 -yl-phenyl)-butyl-carbamoyl]-benzoic acid ([11C]methoxy-repaglinide): a potential beta-cell imaging agent. Bioorg Med Chem Lett. 2004;14:5205–5209. - PubMed
    1. Garcia A, Mirbolooki MR, Constantinescu C, et al. 18F-Fallypride PET of pancreatic islets: in vitro and in vivo rodent studies. J Nucl Med. 2011;52:1125–1132. - PubMed
    1. Kung HF, Lieberman BP, Zhuang Z-P, et al. In vivo imaging of vesicular monoamine transporter 2 in pancreas using an 18F epoxide derivative of tetrabenazine. Nucl Med Biol. 2008;35:825–837. - PMC - PubMed

Publication types