

Rapid monitoring of cerebral ischemia dynamics using laser-based optical imaging of blood oxygenation and flow
- PMID: 22574265
- PMCID: PMC3345806
- DOI: 10.1364/BOE.3.000777
Rapid monitoring of cerebral ischemia dynamics using laser-based optical imaging of blood oxygenation and flow
Abstract
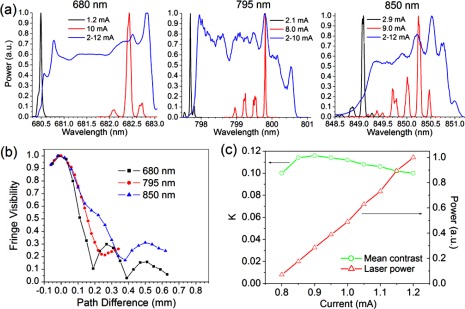
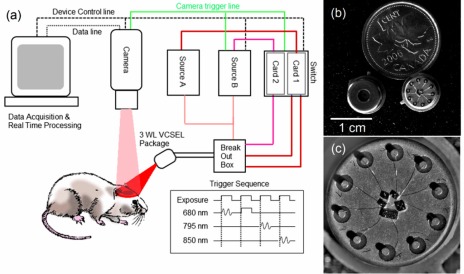
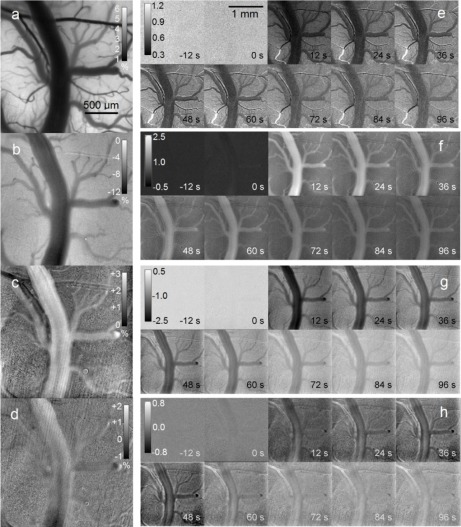
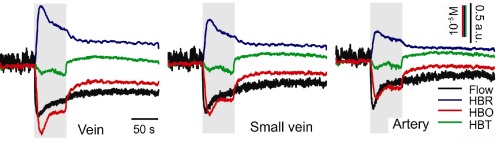
Imaging blood flow or oxygenation changes using optical techniques is useful for monitoring cortical activity in healthy subjects as well as in diseased states such as stroke or epilepsy. However, in order to gain a better understanding of hemodynamics in conscious, freely moving animals, these techniques must be implemented in a small scale, portable design that is adaptable to a wearable format. We demonstrate a novel system which combines the two techniques of laser speckle contrast imaging and intrinsic optical signal imaging simultaneously, using compact laser sources, to monitor induced cortical ischemia in a full field format with high temporal acquisition rates. We further demonstrate the advantages of using combined measurements of speckle contrast and oxygenation to establish absolute flow velocities, as well as to statistically distinguish between veins and arteries. We accomplish this system using coherence reduction techniques applied to Vertical Cavity Surface Emitting Lasers (VCSELs) operating at 680, 795 and 850 nm. This system uses minimal optical components and can easily be adapted into a portable format for continuous monitoring of cortical hemodynamics.
Keywords: (140.2020) Diode lasers; (170.0110) Imaging systems; (170.3880) Medical and biological imaging; (170.6480) Spectroscopy, speckle.
Figures

Similar articles
-
Evaluation of laser speckle contrast imaging as an intrinsic method to monitor blood brain barrier integrity.Biomed Opt Express. 2013 Aug 30;4(10):1856-75. doi: 10.1364/BOE.4.001856. eCollection 2013. Biomed Opt Express. 2013. PMID: 24156049 Free PMC article.
-
Multi-modality optical neural imaging using coherence control of VCSELs.Opt Express. 2011 May 23;19(11):10747-61. doi: 10.1364/OE.19.010747. Opt Express. 2011. PMID: 21643331
-
Vertical-cavity surface-emitting laser sources for gigahertz-bandwidth, multiwavelength frequency-domain photon migration.J Biomed Opt. 2017 Oct;22(10):1-8. doi: 10.1117/1.JBO.22.10.105001. J Biomed Opt. 2017. PMID: 28986966 Free PMC article.
-
Optical detection of brain function: simultaneous imaging of cerebral vascular response, tissue metabolism, and cellular activity in vivo.Rev Neurosci. 2011;22(6):695-709. doi: 10.1515/RNS.2011.053. Epub 2011 Nov 18. Rev Neurosci. 2011. PMID: 22098474 Review.
-
Laser Speckle Imaging to Monitor Microvascular Blood Flow: A Review.IEEE Rev Biomed Eng. 2016;9:106-20. doi: 10.1109/RBME.2016.2532598. Epub 2016 Feb 24. IEEE Rev Biomed Eng. 2016. PMID: 26929060 Review.
Cited by
-
Visualization of two-dimensional transverse blood flow direction using optical coherence tomography angiography.J Biomed Opt. 2020 Dec;25(12):126003. doi: 10.1117/1.JBO.25.12.126003. J Biomed Opt. 2020. PMID: 33331149 Free PMC article.
-
Functional ultrasound imaging of stroke in awake rats.Elife. 2023 Nov 21;12:RP88919. doi: 10.7554/eLife.88919. Elife. 2023. PMID: 37988288 Free PMC article.
-
Evaluation of laser speckle contrast imaging as an intrinsic method to monitor blood brain barrier integrity.Biomed Opt Express. 2013 Aug 30;4(10):1856-75. doi: 10.1364/BOE.4.001856. eCollection 2013. Biomed Opt Express. 2013. PMID: 24156049 Free PMC article.
-
Data compression and improved registration for laser speckle contrast imaging of rodent brains.Biomed Opt Express. 2018 Oct 19;9(11):5615-5634. doi: 10.1364/BOE.9.005615. eCollection 2018 Nov 1. Biomed Opt Express. 2018. PMID: 30460150 Free PMC article.
-
Imaging brain activity during seizures in freely behaving rats using a miniature multi-modal imaging system.Biomed Opt Express. 2016 Aug 22;7(9):3596-3609. doi: 10.1364/BOE.7.003596. eCollection 2016 Sep 1. Biomed Opt Express. 2016. PMID: 27699123 Free PMC article.
References
-
- Jones P. B., Shin H. K., Boas D. A., Hyman B. T., Moskowitz M. A., Ayata C., Dunn A. K., “Simultaneous multispectral reflectance imaging and laser speckle flowmetry of cerebral blood flow and oxygen metabolism in focal cerebral ischemia,” J. Biomed. Opt. 13(4), 044007 (2008).10.1117/1.2950312 - DOI - PMC - PubMed
LinkOut - more resources
Full Text Sources