Quantitative metabolomic profiling of serum, plasma, and urine by (1)H NMR spectroscopy discriminates between patients with inflammatory bowel disease and healthy individuals
- PMID: 22574726
- PMCID: PMC3558013
- DOI: 10.1021/pr300139q
Quantitative metabolomic profiling of serum, plasma, and urine by (1)H NMR spectroscopy discriminates between patients with inflammatory bowel disease and healthy individuals
Abstract
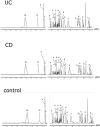
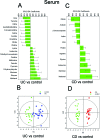
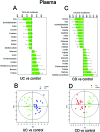
Serologic biomarkers for inflammatory bowel disease (IBD) have yielded variable differentiating ability. Quantitative analysis of a large number of metabolites is a promising method to detect IBD biomarkers. Human subjects with active Crohn's disease (CD) and active ulcerative colitis (UC) were identified, and serum, plasma, and urine specimens were obtained. We characterized 44 serum, 37 plasma, and 71 urine metabolites by use of (1)H NMR spectroscopy and "targeted analysis" to differentiate between diseased and non-diseased individuals, as well as between the CD and UC cohorts. We used multiblock principal component analysis and hierarchical OPLS-DA for comparing several blocks derived from the same "objects" (e.g., subject) to examine differences in metabolites. In serum and plasma of IBD patients, methanol, mannose, formate, 3-methyl-2-oxovalerate, and amino acids such as isoleucine were the metabolites most prominently increased, whereas in urine, maximal increases were observed for mannitol, allantoin, xylose, and carnitine. Both serum and plasma of UC and CD patients showed significant decreases in urea and citrate, whereas in urine, decreases were observed, among others, for betaine and hippurate. Quantitative metabolomic profiling of serum, plasma, and urine discriminates between healthy and IBD subjects. However, our results show that the metabolic differences between the CD and UC cohorts are less pronounced.
Figures


References
-
- Loftus E. J. Clinical epidemiology of inflammatory bowel disease: Incidence, prevalence, and environmental influences. Gastroenterology 2004, 12661504–1517. - PubMed
-
- Molodecky N. A.; Soon I. S.; Rabi D. M.; Ghali W. A.; Ferris M.; Chernoff G.; Benchimol E. I.; Panaccione R.; Ghosh S.; Barkema H. W.; Kaplan G. G. Increasing incidence and prevalence of the inflammatory bowel diseases with time, based on systematic review. Gastroenterology 2011, 142, 46–54. - PubMed
-
- Hanauer S. Inflammatory bowel disease: epidemiology, pathogenesis, and therapeutic opportunities. Inflamm. Bowel Dis. 2006, 12Suppl 1S3–9. - PubMed
-
- Panteris V.; Haringsma J.; Kuipers E. Colonoscopy perforation rate, mechanisms and outcome: from diagnostic to therapeutic colonoscopy. Endoscopy 2009, 4111941–951. - PubMed
Publication types
MeSH terms
Grants and funding
LinkOut - more resources
Full Text Sources
Other Literature Sources
Medical

