

Associations between complex OHC mixtures and thyroid and cortisol hormone levels in East Greenland polar bears
- PMID: 22575327
- PMCID: PMC3366032
- DOI: 10.1016/j.envres.2012.04.010
Associations between complex OHC mixtures and thyroid and cortisol hormone levels in East Greenland polar bears
Abstract
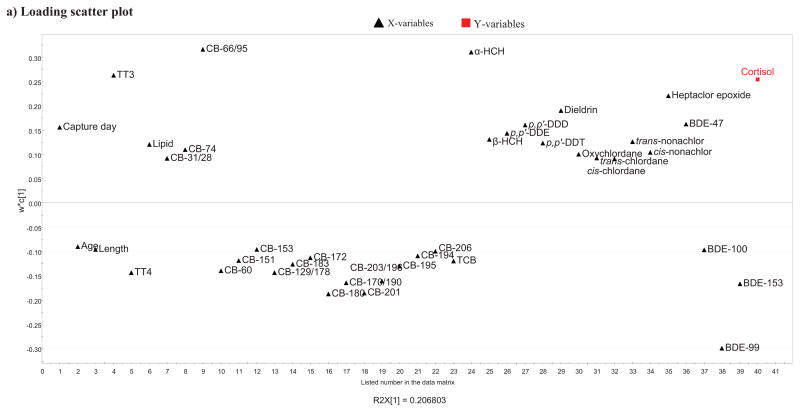
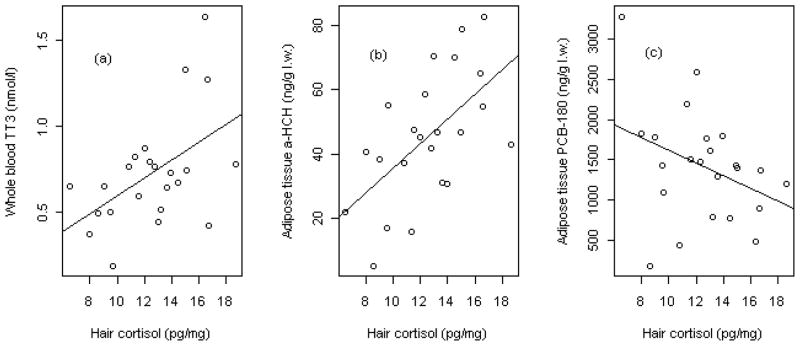
The multivariate relationship between hair cortisol, whole blood thyroid hormones, and the complex mixtures of organohalogen contaminant (OHC) levels measured in subcutaneous adipose of 23 East Greenland polar bears (eight males and 15 females, all sampled between the years 1999 and 2001) was analyzed using projection to latent structure (PLS) regression modeling. In the resulting PLS model, most important variables with a negative influence on cortisol levels were particularly BDE-99, but also CB-180, -201, BDE-153, and CB-170/190. The most important variables with a positive influence on cortisol were CB-66/95, α-HCH, TT3, as well as heptachlor epoxide, dieldrin, BDE-47, p,p'-DDD. Although statistical modeling does not necessarily fully explain biological cause-effect relationships, relationships indicate that (1) the hypothalamic-pituitary-adrenal (HPA) axis in East Greenland polar bears is likely to be affected by OHC-contaminants and (2) the association between OHCs and cortisol may be linked with the hypothalamus-pituitary-thyroid (HPT) axis.
Copyright © 2012 Elsevier Inc. All rights reserved.
Figures


Similar articles
-
Exposure to mixtures of organohalogen contaminants and associative interactions with thyroid hormones in East Greenland polar bears (Ursus maritimus).Environ Int. 2011 May;37(4):694-708. doi: 10.1016/j.envint.2011.01.012. Epub 2011 Feb 23. Environ Int. 2011. PMID: 21345491
-
Reproductive performance in East Greenland polar bears (Ursus maritimus) may be affected by organohalogen contaminants as shown by physiologically-based pharmacokinetic (PBPK) modelling.Chemosphere. 2009 Dec;77(11):1558-68. doi: 10.1016/j.chemosphere.2009.09.044. Epub 2009 Oct 27. Chemosphere. 2009. PMID: 19863991
-
A screening of persistent organohalogenated contaminants in hair of East Greenland polar bears.Sci Total Environ. 2010 Oct 15;408(22):5613-8. doi: 10.1016/j.scitotenv.2010.07.059. Epub 2010 Aug 30. Sci Total Environ. 2010. PMID: 20800875
-
Exposure and effects assessment of persistent organohalogen contaminants in arctic wildlife and fish.Sci Total Environ. 2010 Jul 1;408(15):2995-3043. doi: 10.1016/j.scitotenv.2009.10.038. Epub 2009 Nov 12. Sci Total Environ. 2010. PMID: 19910021 Review.
-
Health effects from long-range transported contaminants in Arctic top predators: An integrated review based on studies of polar bears and relevant model species.Environ Int. 2010 Jul;36(5):461-91. doi: 10.1016/j.envint.2010.03.002. Epub 2010 Apr 15. Environ Int. 2010. PMID: 20398940 Review.
Cited by
-
Mercury and cortisol in Western Hudson Bay polar bear hair.Ecotoxicology. 2015 Aug;24(6):1315-21. doi: 10.1007/s10646-015-1506-9. Epub 2015 Jun 5. Ecotoxicology. 2015. PMID: 26044932
-
Validation of a novel method to create temporal records of hormone concentrations from the claws of ringed and bearded seals.Conserv Physiol. 2020 Aug 25;8(1):coaa073. doi: 10.1093/conphys/coaa073. eCollection 2020. Conserv Physiol. 2020. PMID: 32864135 Free PMC article.
-
Population density-dependent hair cortisol concentrations in rhesus monkeys (Macaca mulatta).Psychoneuroendocrinology. 2014 Apr;42:59-67. doi: 10.1016/j.psyneuen.2014.01.002. Epub 2014 Jan 9. Psychoneuroendocrinology. 2014. PMID: 24636502 Free PMC article.
-
Does habitat disturbance affect stress, body condition and parasitism in two sympatric lemurs?Conserv Physiol. 2016 Sep 10;4(1):cow034. doi: 10.1093/conphys/cow034. eCollection 2016. Conserv Physiol. 2016. PMID: 27656285 Free PMC article.
-
Minireview: Hair cortisol: a novel biomarker of hypothalamic-pituitary-adrenocortical activity.Endocrinology. 2012 Sep;153(9):4120-7. doi: 10.1210/en.2012-1226. Epub 2012 Jul 9. Endocrinology. 2012. PMID: 22778226 Free PMC article. Review.
References
-
- Abdelouahab N, Mergler D, Takser L, Vanier C, St-Jean M, Baldwin M, Spear PA, Chan HM. Gender differences in the effects of organochlorines, mercury, and lead on thyroid hormone levels in lakeside communities of Quebec (Canada) Environmental Research. 2008;107:380–392. - PubMed
-
- AMAP (Arctic Monitoring and Assessment Programme) AMAP assessment 2002: persistent organic pollutants in the Arctic. Arctic Monitoring and Assessment Programme; Oslo: 2004.
-
- Bergman A, Olsson M. Pathology of Baltic grey seal and ringed seal females with special reference to adrenocortical hyperplasia: Is environmental pollution the cause of a widely distributed disease syndrome? Finnish Game Research. 1985;44:47–62.
Publication types
MeSH terms
Substances
Grants and funding
LinkOut - more resources
Full Text Sources
Research Materials
