. 2012 May 8;22(9):R350-9.
doi: 10.1016/j.cub.2012.02.041. Epub 2012 May 7.

Cell size control in yeast

Affiliations

Cell size control in yeast

Jonathan J Turner et al. Curr Biol. .

Abstract

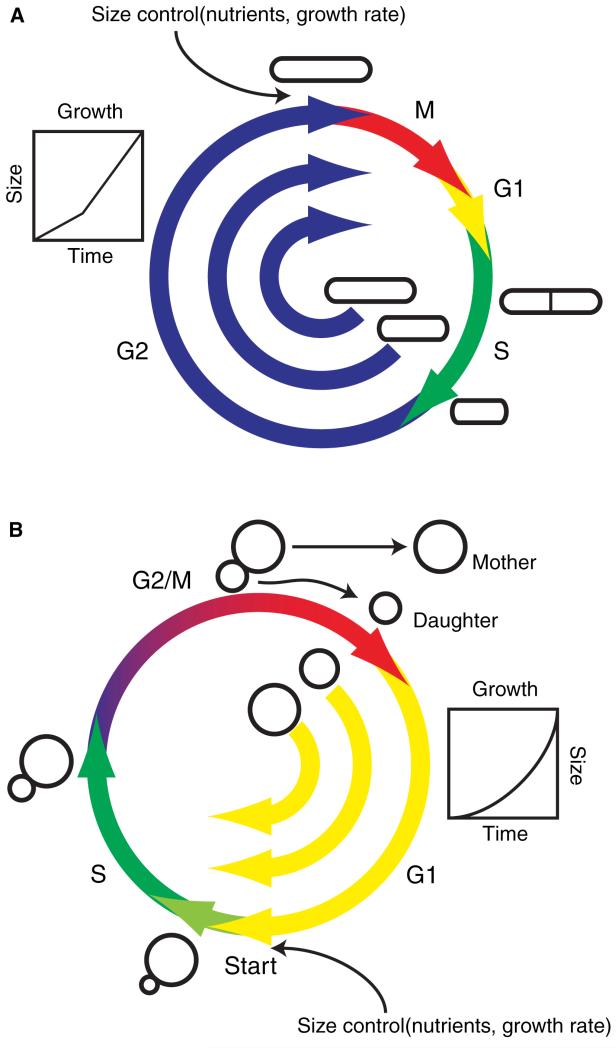
Cell size is an important adaptive trait that influences nearly all aspects of cellular physiology. Despite extensive characterization of the cell-cycle regulatory network, the molecular mechanisms coupling cell growth to division, and thereby controlling cell size, have remained elusive. Recent work in yeast has reinvigorated the size control field and suggested provocative mechanisms for the distinct functions of setting and sensing cell size. Further examination of size-sensing models based on spatial gradients and molecular titration, coupled with elucidation of the pathways responsible for nutrient-modulated target size, may reveal the fundamental principles of eukaryotic cell size control.


Figures

Figure 1
Figure 1. Yeast models for cell size control
S. pombe and S. cerevisiae are the preeminent model organisms for cell size control studies. Interestingly, S. cerevisiae and A. gossypii are more closely related than either is to S. pombe. Despite their divergent morphologies, these two yeasts are regulated by similar cell cycle control networks governing the DNA to cytoplasm ratio.
Figure 2
Figure 2. Size-dependent cell cycle progression in S. pombe and S. cerevisiae
A. S. pombe cells enter G2 at different sizes following S-phase. They grow in a bilinear fashion and enter mitosis upon reaching a threshold size, so that smaller cells spend more time in G2 than larger cells, as indicated. B.S. cerevisiae daughter cells are born at different sizes and grow exponentially. Smaller cells spend more time in G1 prior to Start than larger cells (as indicated), which partially compensates for initial size variation. Thus, size control, a function of nutrient conditions and growth rate, is exerted at G2-M in S. pombe and within G1 in S. cerevisiae.
Figure 3
Figure 3. Single-cell size control assay as applied to S. cerevisiae
A.Size control leads to a negative correlation between cell size at birth and growth in G1. Live-cell imaging techniques allow cells to be tracked from birth to budding, which is concomitant with DNA synthesis.B. Plotting the logarithm of size at birth vs. relative growth in G1 quantifies the efficiency of G1 size control. A slope of −1 would indicate perfect size control, whereas as slope of 0 indicates a lack of size control. Wild-type S.cerevisiae exhibit imperfect but significant size control, as indicated by the −0.7 slope relating birth size to growth in G1.C. Deletion of the cell cycle control gene WHI5 greatly diminishes the efficiency of size control, as indicated by the reduced slope of −0.3. Data adapted from ref. [17].
Figure 4
Figure 4. Models of size-dependent cell cycle regulatory networks
Activators of cell cycle progression are colored green; inhibitors are colored red. A. In S. pombe, size control acts at the G2-M transition. The mitotic inhibitory kinase Pom1, localized to a membrane gradient originating at the cell poles, inhibits the pro-mitotic kinase Cdr2, which is localized in cortical nodes at the midcell. Cdr2, in turn, inhibits the Wee1 kinase, which inhibits CDK1. As pombe cells grow in length, the medial concentration of Pom1 decreases, allowing activation of Cdc13-CDK1 and entry into mitosis. B. In S. cerevisiae, size control acts at the G1-S transition. CDK1 in complex with the upstream G1 cyclin Cln3, whose activity is growth-dependent, activates the G1-S transcription factor SBF by direct phosphorylation and by inactivating the transcriptional inhibitor Whi5. This activates a transcriptional positive feedback loop that leads to a switch-like entry into S-phase. Importantly, Cln3 acts on promoter-bound SBF-Whi5 complexes, suggesting that Cln3 actiivty may be titrated against promoter-bound SBF.

References

    1. Thompson DAW, Whyte LL. On growth and form. Cambridge University Press; Cambridge: 1942.
    1. Payne JL, Groves JR, Jost AB, Nguyen T, Myhre S, Hill TM, Skotheim JS. Late Paleozoic fusulinoidean gigantism driven by atmospheric hyperoxia. - PubMed
    1. Payne JL, Jost AB, Wang SC, Skotheim JS. A permanent shift in the evolutionary dynamics of organism size caused by the end-Permian mass extinction.
    1. Chan Y-HM, Marshall WF. Scaling properties of cell and organelle size. Organogenesis. 2010;6:88–96. - PMC - PubMed
    1. Gregory TR. Coincidence, coevolution, or causation? DNA content, cell size, and the C-value enigma. Biol Rev CambPhilosSoc. 2001;76:65–101. - PubMed

Publication types

MeSH terms

LinkOut - more resources