. 2012 Aug 1;21(15):3408-20.
doi: 10.1093/hmg/dds173. Epub 2012 May 9.

Disease severity in a mouse model of ataxia telangiectasia is modulated by the DNA damage checkpoint gene Hus1

Affiliations

Disease severity in a mouse model of ataxia telangiectasia is modulated by the DNA damage checkpoint gene Hus1

Gabriel Balmus et al. Hum Mol Genet. .

Abstract

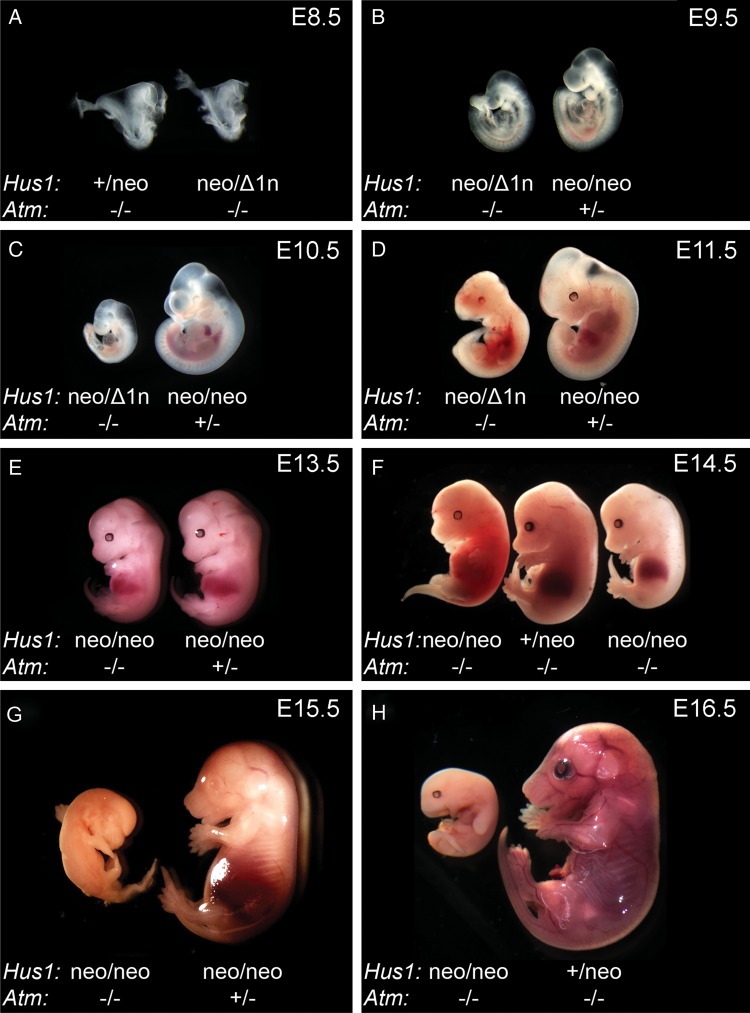
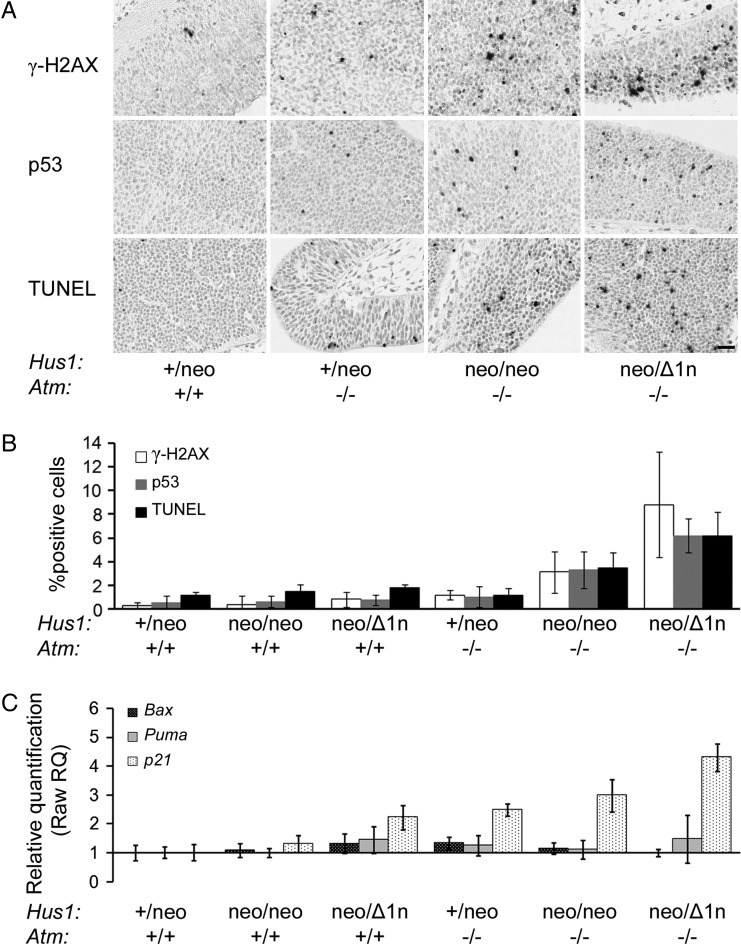
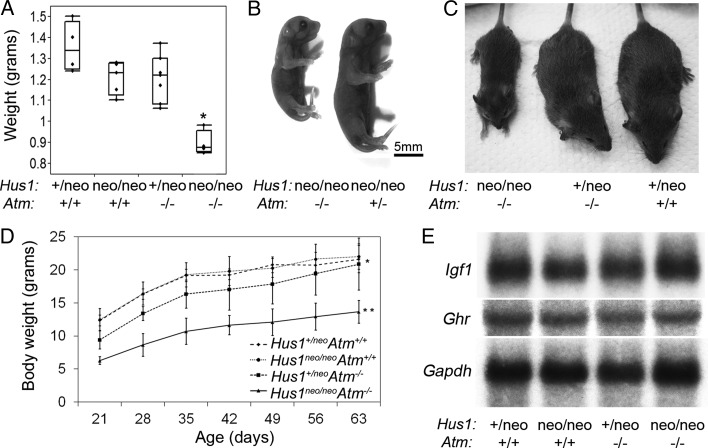
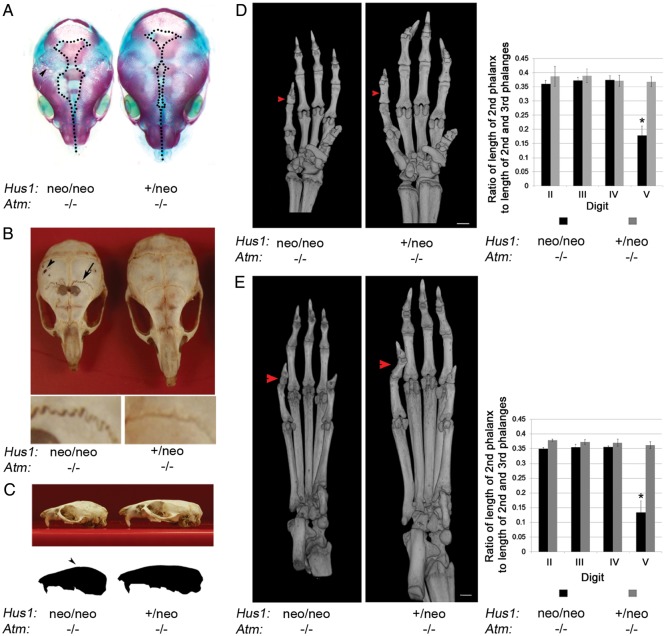
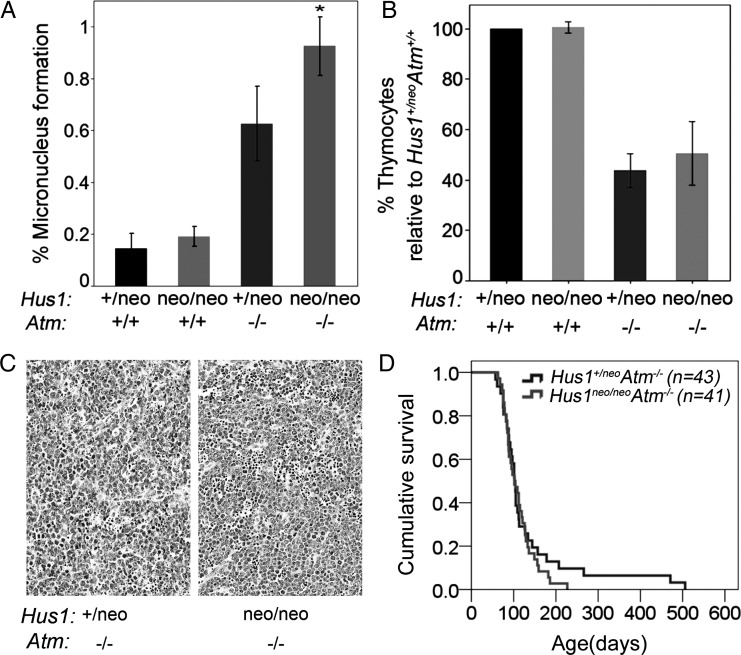
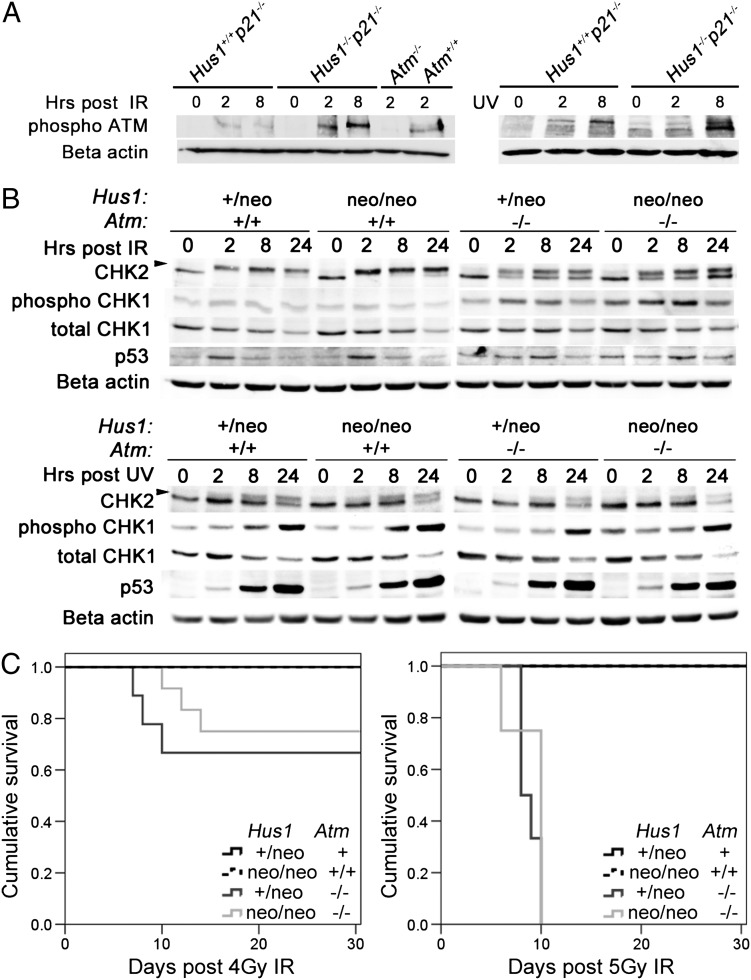
The human genomic instability syndrome ataxia telangiectasia (A-T), caused by mutations in the gene encoding the DNA damage checkpoint kinase ATM, is characterized by multisystem defects including neurodegeneration, immunodeficiency and increased cancer predisposition. ATM is central to a pathway that responds to double-strand DNA breaks, whereas the related kinase ATR leads a parallel signaling cascade that is activated by replication stress. To dissect the physiological relationship between the ATM and ATR pathways, we generated mice defective for both. Because complete ATR pathway inactivation causes embryonic lethality, we weakened the ATR mechanism to different degrees by impairing HUS1, a member of the 911 complex that is required for efficient ATR signaling. Notably, simultaneous ATM and HUS1 defects caused synthetic lethality. Atm/Hus1 double-mutant embryos showed widespread apoptosis and died mid-gestationally. Despite the underlying DNA damage checkpoint defects, increased DNA damage signaling was observed, as evidenced by H2AX phosphorylation and p53 accumulation. A less severe Hus1 defect together with Atm loss resulted in partial embryonic lethality, with the surviving double-mutant mice showing synergistic increases in genomic instability and specific developmental defects, including dwarfism, craniofacial abnormalities and brachymesophalangy, phenotypes that are observed in several human genomic instability disorders. In addition to identifying tissue-specific consequences of checkpoint dysfunction, these data highlight a robust, cooperative configuration for the mammalian DNA damage response network and further suggest HUS1 and related genes in the ATR pathway as candidate modifiers of disease severity in A-T patients.


Figures

Figure 1.
Figure 1.
Embryonic lethality upon simultaneous deregulation of Atm and Hus1. Embryos from timed matings were isolated at the indicated stage of embryonic development, imaged for morphological assesment and genotyped by PCR. (AD) Representative images of Hus1neo/Δ1nAtm−/− embryos and control littermates from E8.5 to E11.5. (EH) Representative images of Hus1neo/neoAtm−/− embryos and control littermates from E13.5 to E16.5. Note that, at E14.5, some Hus1neo/neoAtm−/− embryos are dead, whereas others are smaller than control littermates but otherwise normal.
Figure 2.
Figure 2.
Significantly increased apoptosis and DDR activation in Atm/Hus1 double-mutant embryos. Sections of E10.5 Atm/Hus1 embryos of the indicated genotypes were stained for γ-H2AX, for p53 or by TUNEL assay. (A) Representative images of embryo neural tube sections stained for γ-H2AX, p53 and TUNEL are shown. The scale bar represents 25 µm. (B) The percentage of γ-H2AX, TUNEL or p53-positive cells. Values are the mean of at least three embryos per genotype; error bars indicate standard deviation. Quantification was performed in the neural ectoderm to ensure that equivalent cell populations were compared between genotypes; however, similar staining patterns were observed throughout the embryos, irrespective of the cell type. The percentage of positively stained cells in Hus1neo/Δ1nAtm−/− and Hus1neo/neoAtm−/− embryos was significantly different from each other (P< 0.05, Student's t-test) and when each was compared with all the other genotypes (P< 0.01, Student's t-test). (C) The bar graph representing the fold increase in the expression level of p21, Bax and Puma for the embryos of the indicated genotype relative to Hus1+/neoAtm+/+ as measured by qPCR. p21 expression was significantly increased in Hus1neo/Δ1nAtm+/+, Hus1+/neoAtm−/−, Hus1neo/neoAtm−/− and Hus1neo/Δ1nAtm−/− embryos (P< 0.05, Student's t-test) and was significantly greater in Hus1neo/Δ1nAtm−/− embryos when compared with all other genotypes (P< 0.05, Student's t-test).
Figure 3.
Figure 3.
Dwarfism in Hus1neo/neoAtm−/− embryos and adult mice. (A) The box plot indicates the body weight of E18.5 embryos of the indicated genotypes (n≥ 4 per group). Hus1neo/neoAtm−/− embryos were significantly smaller than their littermates (P< 0.001, Student's t-test). (B) A representative image of newborn (P1) littermates of the indicated genotypes is shown. The scale bar represents 5 mm. (C) The photograph of 6-week-old male littermates of the indicated genotypes. (D) Body weight analysis of Hus1neo/neoAtm−/− mice and control littermates. The average body weights of female mice (n≥ 5 per genotype) of the indicated genotypes, from weaning to 9 weeks of age, are shown. The mean body weight was significantly lower for Hus1+/neoAtm−/− mice when compared with the Atm+/+ groups (*P< 0.05, mixed model analysis); Hus1neo/neoAtm−/− mice had significantly lower mean body weight when compared with all other groups (**P<0.01, mixed model analysis). (E) Northern blot analysis of transcript levels of Igf1 and Ghr in total RNA from the liver. Gapdh was used as a loading control.
Figure 4.
Figure 4.
Skeletal abnormalities in Hus1neo/neoAtm−/− embryos and adult mice. (A) Shown is a representative image of Alizarin red–Alcian blue-stained skulls from E18.5 littermates of the indicated genotypes. Dotted lines outline the region where the skull plates have yet to fill in and fuse. The arrowhead indicates the fenestrations present in the Hus1neo/neoAtm−/− skull. (B) Skulls were prepared from 6-week-old littermates of the indicated genotypes and photographed. The arrowhead indicates the fenestrations present in the parietal bone. The arrow indicates abnormal sutures of the mutant. Lower panels: higher magnification view of sutures in the Hus1neo/neoAtm−/− (left) and Hus1+/neoAtm−/− (right) skulls. (C) A representative image of the skulls from 6-week-old littermates of the indicated genotypes is shown. The outline was generated in Adobe Photoshop to illustrate the doming of the skull. (D and E) 3D reconstructions based on micro-CT data for forelimbs (D) or hindlimbs (E) from Hus1neo/neoAtm−/− and Hus1+/neoAtm−/− mice, and the bar graphs of the corresponding measurement data (n=3 per genotype). Red arrowheads point to the mesophalanx of digit V. The relative length of mesophalanx V in both forelimbs and hindlimbs was significantly shorter in Hus1neo/neoAtm−/− mice when compared with all other genotypes (*P< 0.001, Student's t-test).
Figure 5.
Figure 5.
Increased genomic instability with no change in tumor predisposition in Hus1neo/neoAtm−/− mice. (A) The bar graph shows the average percentage of peripheral blood cells with MN in mice of the indicated genotypes. Hus1neo/neoAtm+/+ and Hus1+/neoAtm+/+ mice showed similar levels of GIN, whereas Hus1+/neoAtm−/− mice had a significant increase in MN formation (P< 0.001, Student's t-test). The combined effect of Hus1 impairment in an Atm null background (Hus1neo/neoAtm−/−) resulted in a greater than additive increase in GIN (P=0.002, univariate analysis of variance). (B) The bar graph shows the relative number of thymocytes in 6-week-old mice of the indicated genotypes (n≥3 per group) expressed as a percentage of the value for Hus1+/neoAtm+/+ control littermates. Error bars indicate standard deviation. The entire thymus from each mouse was harvested and mechanically disrupted, and viable trypan-blue-negative thymocytes were counted using a hemocytometer. The relative number of thymocytes was significantly lower for both Hus1+/neoAtm−/− and Hus1neo/neoAtm−/− mice (*P<0.001, Student's t-test). (C) Representative hematoxylin and eosin-stained sections of thymic lymphomas from Hus1+/neoAtm−/− (left) and Hus1neo/neoAtm−/− (right) mice. The scale bar represents 50 µm. (D) Cohorts of Hus1neo/neoAtm−/− (n=41) and Hus1+/neoAtm−/− (n=43) mice were monitored for tumor development as described in Materials and Methods. A Kaplan–Meier survival curve is shown. Overall survival was not significantly different between genotypes (P=0.644, log-rank test).
Figure 6.
Figure 6.
DNA damage signaling in Atm/Hus1 double-mutant MEFs. (A) Immortalized MEFs of the indicated genotypes were treated with 20 Gy IR or 65 J/m2 UV, and total protein lysates were prepared at 0, 2 and 8 h post-treatment. Samples were immunoblotted using antibodies specific for phospho-Ser1981-ATM, or beta-actin as a loading control. Similar results were obtained with an independent set of Hus1−/−p21−/− and matched control Hus1+/+p21−/− MEFs (data not shown). (B) Primary MEFs at passage 1 or 2 were treated with 30 Gy IR or 65 J/m2 UV, and total cell protein lysates were prepared at 0, 2, 8 and 24 h post-treatment and immunoblotted for CHK1, phosphoSer345-CHK1, CHK2 and p53. The arrow indicates the position of phosphorylated CHK2. Beta-actin was used as a loading control. (C) Kaplan–Meier survival curves show the radiation sensitivity of mice of the indicated genotypes, following exposure to 4 Gy (left) or 5 Gy (right) IR. The cohort treated with 4 Gy included Hus1+/neoAtm+ (n=7; Atm+ is a combination of Atm+/+ and Atm+/−), Hus1neo/neoAtm+/+ (n=6), Hus1+/neoAtm−/− (n=9) and Hus1neo/neoAtm−/− (n=12) mice. The cohort treated with 5 Gy included Hus1+/neoAtm+ (n= 4), Hus1neo/neoAtm+/+ (n=6), Hus1+/neoAtm−/− (n=6) and Hus1neo/neoAtm−/− (n=4) mice. There were no significant differences in survival between Hus1+/neoAtm−/− and Hus1neo/neoAtm−/− mice after 4 Gy (P=0.295) or 5 Gy (P=0.366) as determined by the log-rank test.

References

    1. McKinnon P.J. ATM and the molecular pathogenesis of ataxia telangiectasia. Annu. Rev. Pathol. 2012;7:303–321. - PubMed
    1. Gilad S., Chessa L., Khosravi R., Russell P., Galanty Y., Piane M., Gatti R.A., Jorgensen T.J., Shiloh Y., Bar-Shira A. Genotype-phenotype relationships in ataxia-telangiectasia and variants. Am. J. Hum. Genet. 1998;62:551–561. - PMC - PubMed
    1. Jackson S.P., Bartek J. The DNA-damage response in human biology and disease. Nature. 2009;461:1071–1078. - PMC - PubMed
    1. Cimprich K.A., Cortez D. ATR: an essential regulator of genome integrity. Nat. Rev. Mol. Cell Biol. 2008;9:616–627. - PMC - PubMed
    1. Kemp M., Sancar A. DNA distress: just ring 9-1-1. Curr. Biol. 2009;19:R733–R734. - PubMed

Publication types

MeSH terms