Comparative Study
. 2012 Jul 15;28(14):1865-72.
doi: 10.1093/bioinformatics/bts266. Epub 2012 May 9.

Correcting for the bias due to expression specificity improves the estimation of constrained evolution of expression between mouse and human

Affiliations
Comparative Study

Correcting for the bias due to expression specificity improves the estimation of constrained evolution of expression between mouse and human

Barbara Piasecka et al. Bioinformatics. .

Abstract

Motivation: Comparative analyses of gene expression data from different species have become an important component of the study of molecular evolution. Thus methods are needed to estimate evolutionary distances between expression profiles, as well as a neutral reference to estimate selective pressure. Divergence between expression profiles of homologous genes is often calculated with Pearson's or Euclidean distance. Neutral divergence is usually inferred from randomized data. Despite being widely used, neither of these two steps has been well studied. Here, we analyze these methods formally and on real data, highlight their limitations and propose improvements.

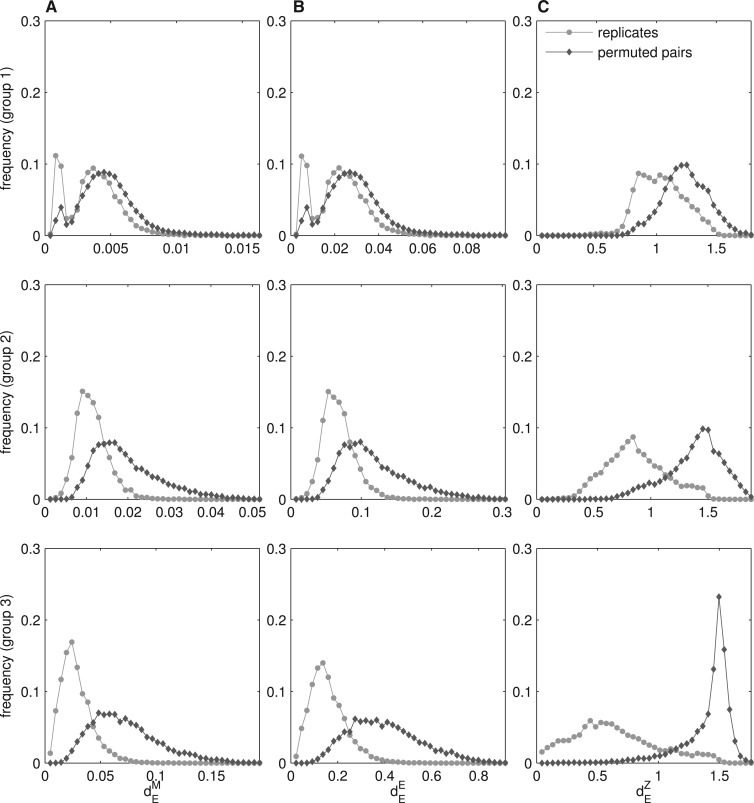
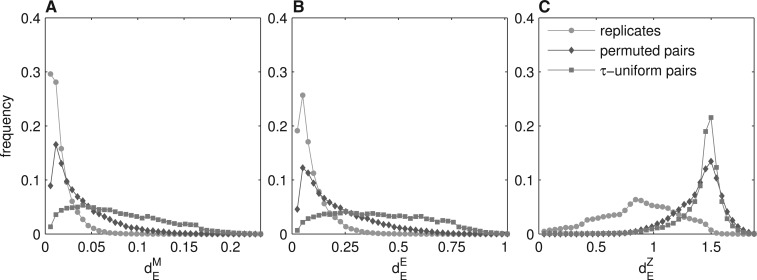
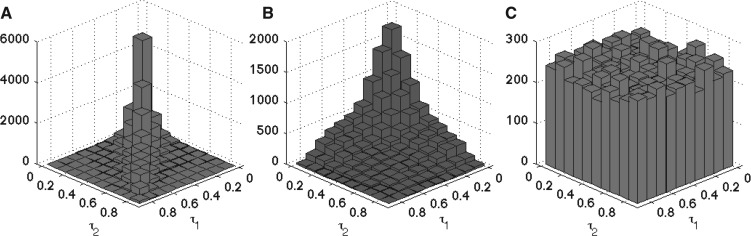
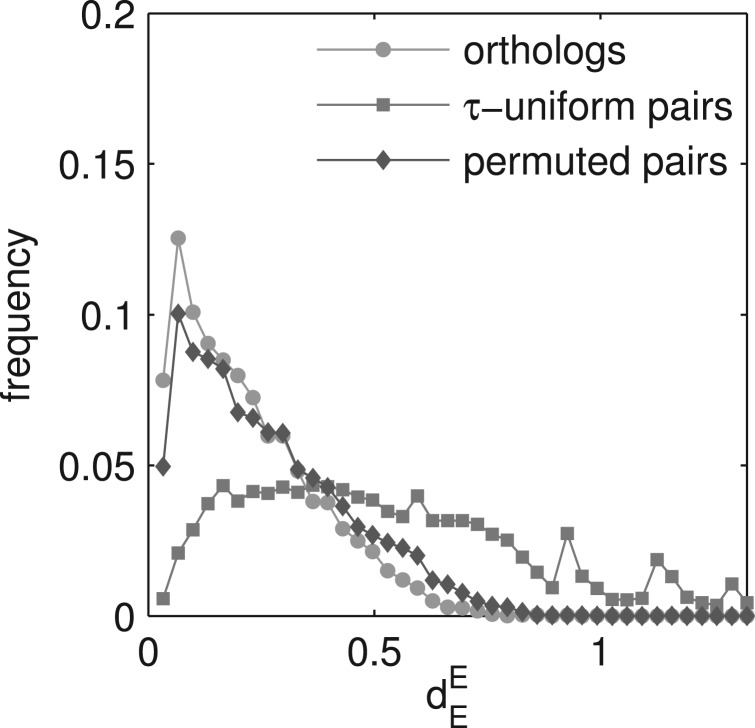
Results: It has been demonstrated that Pearson's distance, in contrast to Euclidean distance, leads to underestimation of the expression similarity between homologous genes with a conserved uniform pattern of expression. Here, we first extend this study to genes with conserved, but specific pattern of expression. Surprisingly, we find that both Pearson's and Euclidean distances used as a measure of expression similarity between genes depend on the expression specificity of those genes. We also show that the Euclidean distance depends strongly on data normalization. Next, we show that the randomization procedure that is widely used to estimate the rate of neutral evolution is biased when broadly expressed genes are abundant in the data. To overcome this problem, we propose a novel randomization procedure that is unbiased with respect to expression profiles present in the datasets. Applying our method to the mouse and human gene expression data suggests significant gene expression conservation between these species.


Figures

Fig. 1.
Fig. 1.
The distribution of expression similarity between human replicates depends on their organ specificity. (A) dEM and (B) dEE are significantly lower for broadly expressed genes (group 1) than for organ-specific genes (group 3). For randomly permuted gene pairs dEM and dEE also differ between the three τ-groups. They are significantly lower for random pairs in group 1 than in group 3. (C) dEZ is significantly higher for broadly expressed genes (group 1) than for organ-specific genes (group 3). dEZ for randomly permuted pairs is high in all three groups, even in the first τ-group, where random pairs consist of two broadly expressed genes (this is a consequence of low r for uniformly expressed genes). Note that the scale of the x-axis differs strongly between graphs.
Fig. 2.
Fig. 2.
Overrepresentation of broadly expressed human genes causes underestimation of the conservation of expression when randomly permuted pairs are used to approximate the neutral evolution rate. (A, B) For most randomly permuted pairs (grey) the distance (dEM and dEE) is small, indistinguishable from the distances between replicates (green). For τ-uniform random pairs (blue) dEE and dEM are higher, which is more consistent with the assumption about neutral evolution (Jordan et al., 2005). (C) dEZ is high both for randomly permuted gene pairs and for the group of replicates. The distribution of dEZ does not change with the new random pairs set.
Fig. 3.
Fig. 3.
Random gene pairs have their τ values differently distributed depending on the randomization procedure used. (A) τ distribution for human replicates. The τ pairs are distributed along the diagonal, which is expected for replicates. (B) τ distribution for randomly permuted gene pairs. The τ pairs are biased towards low values, which are the most frequent values in human datasets. (C) τ distribution for τ-uniform random pairs. The τ pairs are uniformly distributed, and not biased towards the low values.
Fig. 4.
Fig. 4.
The choice of the randomization method changes the conclusions about gene expression evolution between mouse and human. There is no clear evidence for constrained evolution if we compare the distribution of dEE for orthologous (green) and randomly permuted gene pairs (grey). Whereas, comparison of dEE distribution for orthologous (green) and τ-uniform random pairs (blue) suggest that expression evolution is far from neutral.

References

    1. Bastian F., et al. Data Integration in the Life Sciences. Vol. 5109. Springer; 2008. Bgee: integrating and comparing heterogeneous transcriptome data among species; pp. 124–131. of Lecture Notes in Computer Science.
    1. Chan E.T., et al. Conservation of core gene expression in vertebrate tissues. J. Biol. 2009;8:33. - PMC - PubMed
    1. Garber M., et al. Computational methods for transcriptome annotation and quantification using RNA-seq. Nat. Methods. 2011;8:469–77. - PubMed
    1. Hubbard T.J.P., et al. Ensembl 2009. Nucleic Acids Res. 2009;37:D690–D697. - PMC - PubMed
    1. Jordan I.K., et al. Evolutionary significance of gene expression divergence. Gene. 2005;345:119–126. - PMC - PubMed

Publication types