. 2012 Apr;2(4):344-55.
doi: 10.1158/2159-8290.CD-11-0280. Epub 2012 Mar 31.

Metformin accelerates the growth of BRAF V600E-driven melanoma by upregulating VEGF-A

Affiliations

Metformin accelerates the growth of BRAF V600E-driven melanoma by upregulating VEGF-A

Matthew J Martin et al. Cancer Discov. 2012 Apr.

Abstract

The antidiabetic drug metformin has antitumor activity in a variety of cancers because it blocks cell growth by inhibiting TORC1. Here, we show that melanoma cells that are driven by oncogenic BRAF are resistant to the growth-inhibitory effects of metformin because RSK sustains TORC1 activity even when AMP-activated protein kinase (AMPK) is activated. We further show that AMPK targets the dual-specificity protein phosphatase DUSP6 for degradation and this increases ERK activity, which then upregulates the VEGF-A protein. Critically, this drives angiogenesis and accelerates the growth of BRAF-driven tumors in mice. Unexpectedly, however, when VEGF signaling is inhibited, instead of accelerating tumor growth, metformin inhibits tumor growth. Thus, we show that BRAF-driven melanoma cells are resistant to the antigrowth effects of AMPK and that AMPK mediates cell-autonomous and cell-nonautonomous effects that accelerate the growth of these cells in vivo.

Significance: Metformin inhibits the growth of most tumor cells, but BRAF-mutant melanoma cells are resistant to metformin in vitro, and metformin accelerates their growth in vivo. Unexpectedly, VEGF inhibitors and metformin synergize to suppress the growth of BRAF-mutant tumors, revealing a combination of drugs that may be effective in these patients.


Figures

Figure 1
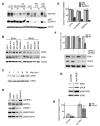
Figure 1. BRAF-mutant melanoma cells are resistant to the anti-growth effects of metformin and AICAR in vitro
A. Colony formation for D04, MM-415, MM-485, WM-1366, WM-852, A375, MDA-MB-435, Mel-HO, SK-Mel28 and WM-266.4 cells in soft-agar in the presence of metformin (Met; 2mM) and AICAR (1mM). Colony numbers are represented relative to DMSO treated controls (%). Error bars: SD from the mean (n=3). B-D. Western blot for phospho-AMPKα (pAMPKα), phospho-ACC (pACC) and total AMPKα (loading control) in SK-Mel28 (B), A375 (C) and D04 cells (D) treated with AICAR (1mM) for the times indicated in hours (hrs).
Figure 2
Figure 2. Constitutive RSK activity confers resistance to metformin in BRAF mutant melanoma cell lines
A. Western blot for phospho-4E-BP1 (p4E-BP1), phospho-rpS6 (pS6[S240/4]) and tubulin (loading control) in A375, Mel-HO, SK-Mel28, D04, MM415 and WM1366 cells in the absence (-) or presence of metformin (M; 2 mM). B. Western blot for phospho-RSK (pRSK), total RSK1 and tubulin (loading control) in the A375, MDA-MB-435, Mel-HO, SK-Mel28, WM266.4, D04, MM415, Sbcl2, WM1361 and WM1366 cells. C. Western blot for phospho-RSK (pRSK) and tubulin (loading control) in A375 cells treated with metformin (Met; 2 mM) for the times indicated in hours. D. Western blot for phospho-AMPKα (AMPKα), AMPKα (loading control), phospho-4E-BP1 (p4EBP1) and phospho-S6 (pS6[235/6]; pS6[240/4]) in A375 cells treated with DMSO, metformin (Met; 2 mM) and BI-D1870 (BI-D; 3 μM) as indicated. E. Colony formation for A375, SK-Mel28 and WM-266.4 cells grown in soft-agar in the presence of metformin (Met.; 2mM) and BI-D1870 (3 μM). Colony numbers are represented relative to vehicle treated controls (%). Error bars: SD from the mean (n=3). F. Colony formation for A375 cells grown in soft-agar and treated with siRNA to RSK1 (siRSK1) or RSK2 (siRSK2) in the presence of water (Ctrl) or metformin (Met; 2mM). Colony numbers are represented relative to mock-transfected water treated controls (column 1; %). Error bars: SD from the mean (n=3. The western blot shows expression of RSK1, RSK2 and tubulin (loading control) in representative samples. G. Western blot for RSK1, phospho-RSK (pRSK), phospho-rpS6 (pS6[235/6]) and ERK2 (loading control) in D04 cells expressing pCDNA vector or myristoylated RSK1 (myr-RSK1). H. Colony formation for D04 cells grown in soft agar and expressing pCDNA vector or myristoylated RSK1 (myr-RSK1) in the presence of metformin (Met; 2mM) or AICAR (0.5mM). Results are relative to the number (%) of colonies formed in control (water) treated wells. Error bars: SD from the mean (n=3).
Figure 3
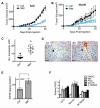
Figure 3. Metformin induces VEGF secretion, increased blood vessel density and enhanced tumor growth in BRAF-mutant melanoma xenografts
A. The growth of A375 cells as tumor xenografts in nude mice treated with metformin (Met) or water (Ctrl) is shown. Error bars represent standard error (n=8). B. The growth of Mel-HO cells as tumor xenografts in nude mice treated with metformin (Met) or water (Ctrl) is shown. Error bars represent standard error (n=5). C. The number of endoglin/CD105 positive vessels in 5 randomly selected high powered fields from sections of A375 xenografts from mice treated with water (Ctrl.; n=6) or metformin (Met.; n=9) is shown. Bar: mean; error bars: SD. D. Representative images of tumor xenograft sections of control and metformin-treated tumors immunostained for endoglin/CD105 (brown). Bar = 50 μm. E. VEGF-A protein levels in A375 xenografts from water (Ctrl; n=14) and Metformin (Met; n=17) treated mice. Error bars: SD from the mean. F. VEGF-A protein levels in conditioned media from A375, Mel-HO and SK-Mel28 cells treated with DMSO, metformin (Met; 2mM), phenformin (Phen; 0.25mM), AICAR (1mM) or A-769662 (30μM). Error bars: SD from the mean.
Figure 4
Figure 4. Metformin and VEGF-A pathway inhibition induce synthetic lethality in BRAF-mutant melanoma cells in vivo
A. The growth of A375 cells as tumor xenografts in nude mice treated with water (Ctrl), metformin (Met; 300 mg/kg/day) and/or axitinib (Ax; 10 mg/kg/day) is shown. Error bars represent standard error from the mean (n=8). B. The growth of A375 cells in vitro in the presence of metformin (Met; 2mM) and/or axitinib (doses in nM as indicated) is shown. Cell growth determined by SRB assay (n=5) is expressed relative to DMSO treated controls (fold) with error bars to represent SD from the mean. C. The growth of A375 cells as tumor xenografts in nude mice treated with water (Ctrl), metformin (Met; 300 mg/kg/day) and/or bevacizumab (Bev; 1 mg/kg biweekly) is shown. Error bars represent standard error from the mean (n=8). D. VEGF-A protein levels in conditioned media from MDA-MB-435 cells stably expressing control (NS) or two VEGF-A (shV.1, shV.3) shRNA probes and treated with water (Ctrl), metformin (Met; 2mM) or AICAR (1mM). E. The growth of MDA-MB-435 cells expressing control (NS) or VEGF-A (shV.1 or shV.3) shRNA in soft-agar in the absence (Ctrl) of presence of metformin (Met; 2mM) is shown (n=3). Colony numbers are represented relative to control (NS) expressing water treated controls (column 1; %). Error bars: SD from the mean. F. The growth of MDA-MB435 cells expressing control (NS) or VEGF-A (shV.3) shRNA as xenografts in nude mice treated with metformin (Met) or water (Ctrl) is shown. Error bars represent standard error from the mean (n=6).
Figure 5
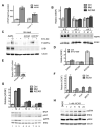
Figure 5. AMPK induces VEGF-A production by upregulating ERK signaling
A. VEGF-A protein levels in conditioned media from A375 cells treated for 24h with vehicle (DMSO), AICAR (1mM), Compound C (Cpd C; 5 μM) or both drugs. Results normalized to DMSO control. Error bars: SD from the mean. B. VEGF-A protein levels in conditioned media from A375 cells treated with non-specific control (N.S), or two AMPKα1 siRNA probes (si-1; si-2) for 72h and treated with water (Ctrl), metformin (Met; 2mM) or AICAR (1mM) for the last 24h. The western blot below shows AMPKα1 and ERK2 (loading control) from the same cells lysed immediately after collection of conditioned media. C = control; M = metformin; A = AICAR. C. Western blot for phospho-AMPKα1 (pAMPKα1), LKB1 and tubulin (loading control) in A375 and SK-Mel5 cells. The A375 cells were untreated (-) or starved for glucose (-G) to provide a control for AMPKα1 phosphorylation. The SK-Mel5 cells were treated with AICAR (1mM), A23187 (1 μM) or STO-609 (10 μM) as shown. D. VEGF-A protein levels in conditioned media from SK-Mel5 cells treated with DMSO, AICAR (1mM), A23187 (1 μM) and STO-609 (10μM) as indicated. Error bars: SD from the mean. E. VEGF-A mRNA levels in A375 cells after treatment with AICAR (1mM) or PD184352 (PD; 1μM) for 6h. Results are presented relative to vehicle treated controls. Error bars: SD from the mean. F. VEGF-A protein levels in conditioned media from A375 cells treated with DMSO, PD184352 (PD; 1μM), PLX4720 (PLX; 500 nM), 885-A (100 nM) and with water (Ctrl) or AICAR as indicated. VEGF-A levels are presented relative to water and DMSO treated controls. Error bars: SD from the mean. G. VEGF-A protein levels in conditioned media from A375 cells transfected with scrambled control (Scr) or two different BRAF specific siRNAs (siB.1, siB.2), and treated with metformin (M; 2mM) or AICAR (A; 1mM). The western blots show BRAF, phospho-ACC (pACC), phospho-ERK (pERK) and ERK2 (loading control). H. Western blot for phospho-ERK (pERK), ERK2, phospho-MEK (pMEK) and tubulin (loading control) in A375 cells treated with AICAR (1mM) for the times indicated in hours (h).
Figure 6
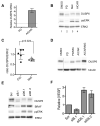
Figure 6. AMPK activation downregulates DUSP6 protein, promoting ERK activity and VEGF production
A. DUSP6 mRNA levels in A375 cells treated with PD184352 (PD; 1μM) or AICAR (1mM) for 6h. Results are presented relative to vehicle treated control cells. Error bars: SD from the mean. B. Western blot for DUSP6, phospho-ERK (pERK) and ERK2 (loading control) in A375 cells treated with DMSO, PD184352 (PD; 1μM), metformin (Met; 2mM) or AICAR (1mM) for 6 hr. C. DUSP6 protein levels in A375 xenografts from water (Ctrl) and Metformin (Met) treated mice (n=5). Levels were measured by densitometry of individual bands of DUSP6 on Western blot, and normalized to the corresponding ERK2 band (loading control; see figure S6). Error bars: SD from the mean. D. Western blot for DUSP6 and tubulin (loading control) in A375 cells treated with PD184352 (PD; 1μM), AICAR (1mM) and MG132 (MG; 1μM) for 6h. E. Western blot for DUSP6, BRAF, phospho-ERK (pERK) and ERK2 (loading control) in A375 cells treated with scrambled control (Scr), BRAF (siB.1) or DUSP6 (siD6.1 or siD6.2) siRNA. F. VEGF-A protein levels in conditioned media from A375 cells treated with scrambled control (Scr), BRAF (siB.1) or DUSP6 (siD6.1 or siD.6.2) siRNA.
Figure 7
Figure 7. Model for signaling networks controlled by AMPK in BRAF-mutant melanoma cells
The activity of each protein is represented according to the colors code indicated by the bar. The relative level of interaction between the components is indicated by the thickness of the lines/arrows between them. A. Under basal conditions oncogenic BRAF activates ERK, which then drives DUSP6 expression to modulate ERK signaling. ERK also activates RSK, which activates TORC1 to drive protein translation. ERK also induces expression of low levels of VEGF-A. B. In metformin treated cells, AMPK is activated and targets the DUSP6 protein for degradation. This results in increased ERK activity and although this increases DUSP6 mRNA levels the protein does not accumulate. ERK also activates RSK, which maintains TORC1 activity despite AMPK activation, and it upregulates VEGF.

References

    1. Gray-Schopfer V, Wellbrock C, Marais R. Melanoma biology and new targeted therapy. Nature. 2007;445:851–7. - PubMed
    1. www.sanger.ac.uk/genetic/CGP/cosmic/
    1. Chapman PB, Hauschild A, Robert C, Haanen JB, Ascierto P, Larkin J, et al. Improved survival with vemurafenib in melanoma with BRAF V600E mutation. N Engl J Med. 2011;364:2507–16. - PMC - PubMed
    1. Flaherty KT, Puzanov I, Kim KB, Ribas A, McArthur GA, Sosman JA, et al. Inhibition of mutated, activated BRAF in metastatic melanoma. N Engl J Med. 2010;363:809–19. - PMC - PubMed
    1. Hardie DG, Scott JW, Pan DA, Hudson ER. Management of cellular energy by the AMP-activated protein kinase system. FEBS Lett. 2003;546:113–20. - PubMed

Publication types

MeSH terms